Burnout and turnover experience: Behind the noble intention in pursuing the Diploma of Nursing program in a Malaysian Institutions of higher learning

Hamidah H.1, Mazlinda   M.2, Rosnah M.3, Azila T.4, Khadijah N@ Roslih.5, Kelvin, J.M.6, NurulIzzatie M.7, Rohani M.8., Siti Fatimah S.9

Authors

1,3,4,5,6,7,8,9Department of Nursing Faculty of Medicine & Health Sciences, University, Sabah, Malaysia

Corresponding Author

2Department of Medical Education, Faculty of Medicine & Health Sciences, University ,Sabah, Malaysia

Email: mazlinda@ums.edu.my

ABSTRACTS

Background: Burnout is defined as psychological syndrome experienced by an individual who is exposed to chronic stress which involved emotional, physical, and mental Exhaustion caused by prolonged excessive stress. As for students, going through the process of learning is a mounting complex stressful phenomenon that remained as the leading cause of poor academic performance and dropped out which sometimes may lead to psychological deviant or situation called depression. This study aimed to discover the causes of student nurses’ Burnout and the intention to leave the program.

Methodology: A cross-sectional survey of 127 nursing was selected based on Krejcie Morgan (1970) sample size calculation. Maslach Burnout Inventory (2016)to measure the burnout realm on emotional Exhaustion, Depersonalization and personal achievement. Twenty-two items with 7- points scale measuring responses of “Never (0)” to “Every day (7)” and three open-ended questions related to the intention of leaving the program.

Results: Thirty-five( 35%) students had the feeling of dropping the program, and 52% had occurred during the first year of the study. Stress and financial struggles triggered the quitting as they felt the course had broken them down.Pursuing the program despite the glitches worth the fights,  99 % of respondents acknowledged that this program is worth their future profession.

Conclusion:They learnt to handle their emotional problem during work. Nursing as a  field of knowledge of humanities has been able to transform the society who were insufficient in lives into good human beings.

Keywords: Burnout, turnover, nursing students, emotional exhausation, academic performance

Received on 4th November 2020, Revised on 18th November 2020, Accepted on 24th  November 2020

DOI:10.36678/IJMAES.2020.V06I04.004

INTRODUCTION

Burnout is a state of emotional, physical, and mental respondents Exhaustion caused by excessive and prolonged stress. It occurs when ones feel overwhelmed, emotionally drained, and unable to meet constant demands.It is associated with feelings of hopelessness and difficulties in dealing with work or in doing the job effectively.’ For students, studying and low academic performance can be the leading cause of burnout drop out, leading to a situation called a depression.Burnout syndrome occurs morefrequently among a particular group of professions. It is increasingly recognized among healthcare professionals, and HRQ is estimating that Burnout may affect 10–70% of nurses and 30–50% of physicians, nurse practitioners, and physician assistantswhich due to the demand interaction with people, work with human recipients of services. Apart from working environment with the public, individuals working in any othersdisciplines involvingwith extreme or hazardous responsibility, precision at the performance of duty, severe consequences, shift work, or tasks and responsibilities not liked, are at risk for development of burnout 1, 2.

Burnout, one of the six dimensions of distress, has many negative implications on both a personal and professional level. Professionally, Burnout can hinder job performance, for personally, Burnout affects character, relationships, and overall quality of life. One-third of American nurses are reported with a burnout epidemic sweeping the country in particular with the emotional exhaustion score,  of 27 or higher, which is considered to be “high burnout.” Feelings of stress and anxiety, emotional detachment and chronic fatigue are all symptoms of Burnout that can have a significant impact on how nurses do their jobs. Nurse burnout will potentially impact the medical industry and Nurse Burnout, and it is a complex rising phenomenon related to stressful working environment 8, 9.

What thought-provoking now is, Burnout not only experienced by trained nurses or medical profession, but it is also commonly affected the nursing students. Numerouscategory of literaturehad addressed these issues of burnout syndromes experienced by students in the classroom, worsteven in the clinical setting 3, 4.  A study on nursing degrees program studentswith highly competitive entrance examsfound that the nursing students who wish to obtain a nursing degree have similar exposures as denoted above. It has been widely accepted that burnout syndrome among the nursing students occurs as early as the training starts and the situation becoming intensified during the practical session13.

Tsang L said the major grievances of the nursing students are at the workplace18. It is where they begin to learn to transfer their classroom knowledge into practice. Factors such a;  the environment of placement, the readiness of the clinical management to accept students’ order, clinical teaching approach,  clinical learning objectives, supervision and support system provided. Most ofthe nursing students experienced impolitenesskind of respect from the seniors and even the medical personnel in the clinical settings. The unfortunatestudents in the clinical areas exploited an avoiding approach in coping with a difficult problem to solve the Burnout 5, 6.

When students began to feel frustrated and issues that are not being addressed, the implications would be mainly on students themselves, the organizations and nursing profession. Theintention  to leave the program or career is the significant implications by some of the nursing students as they experienced Exhaustion or disengagement due to stress to the academic and the clinical issues 7. The purpose of this study is todeterminethe causes of Burnout among the nursing students, with a better understanding of the sourceswill improve the future training system.

Background Of  Study: This study was conducted in one of the nursing institutions in one of the public universities of Higher Learning in East Malaysia. The Nursing Department strives to excel the nursing graduates by providing the Nursing education based upon the principle of belief in God. The three years of a full-time programaimed to produce nurses who are competent and caring through academic excellence training with holistic & innovative nursing practice. Thus, the nursing students were nurtured to be progressive, disciplined, integrated as well as balanced in their intellectual, emotional, physical and spiritual outlook in the hope that those attributes will safeguard our students to be the well-being of society and worthwhile nations.

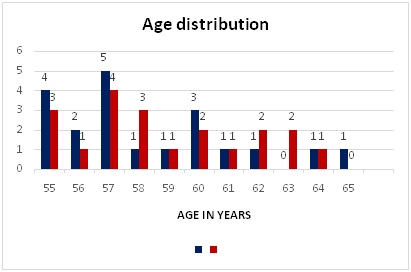
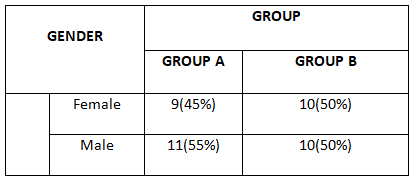
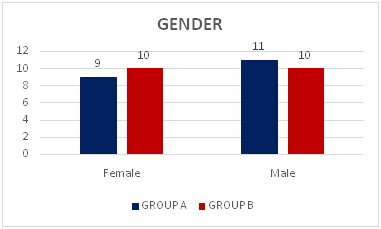
The total number of studentsin this study was 180  students, ranging from Year One till Year Three.Ninety per cent (90% ) of the students were female. The program was conducted based on the Malaysian Nursing Board guidelines.  It has 50% theory and 50% practice with the credit hours of 90 credits for three years,  and the full implementation is five years.  The theory sessions were carried out on the main campus, and all practical training conducted using the facilities of the Malaysian Ministry of Health.

Almost 90% of the students in this study were localscomprises various ethnic groups,undertaking the nursing program.  Most of the students coming into this program with pure intention and interest to assist the sicks. Somebelieved that, by submitting themselves into this field, they would be employed with a permanent job after three years of the rigorous training 14,15

METHODOLOGY

Study design: A is a cross-sectional descriptive studyconducted on theDiploma of Nursing of Year One to Year Three students of the Department of Nursing Faculty of Medicine and  Health Sciences, University Malaysia (UMS).

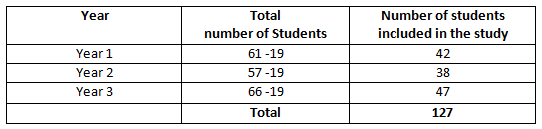
Sample/ Sampling Techniques: The total population was 184 nursing students comprised Year One, Two and Three. The sampling technique was based on Krejcie& Morgan (1970)sampling size, and the required samplewas 127.  Selection of the was made through simple calculation; 184 – 127 = 54 / 3 groups = 19 students were excludedfrom each group, as formulatedin Table 1. Paper logsmarked with number 1 till all will draw number19. Those who received the marked records will be excluded from the study.

Table 1.  Selection of Samplings

Instruments

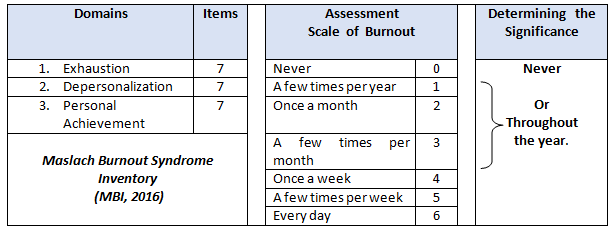
The Instruments comprised two sections;Section A: Social demographic data and  Section B: Maslach Burnout Syndrome Inventory (MBI, 2016) with seven-score scale, ranging from  ‘never’ to ‘always’ as characterized in Table 2.

Table 2: Instrumentation  Measuring  Burnout

Data Collection  process: This studywas  commenced  in September 2019 to December  2019 with a total participationof 127 nursingstudents as respondents. Sets of 22 structured questionnaires and three open-endedquestionnaires were uploadedinto the systemand arranged in accordance to year and group,ranging from Year 1 till Year 3.Selected students had been notified to respond to the questions uploaded. 

A timelinesystem was implemented to each group whereby the distribution of questionnaires was first done to Year One students, followed by Year Two and finally the Year Three students.  Each group was given two weeks to respond to the same questionnaires. Every two weeks data was collected and sorted out into tables and analyzed—the whole data collection processes completed within six weeks.

Data Analysis

Returned questionnaires were checked for completeness, and data were analyzed through  SPSS Version 22. Description of findings was based on the research objectives, emphasizing on theaspectsburnout that transpired the students during the course:

  • Turnover:  Intention ofleaving the Nursing Program
  • Burnout: Due to Exhaustion, Depersonalization and AccomplishmentOther reasons

The  results were  deliberated  based on the following responses  items ;

  • Never
  • Over the year 
  • To organize the significance of results, the responses items were
  • Over the monthwere summarized into two categories:  Never  Or Throughout the year.
  • Over the week

RESULTS   

Table 3:  Socio-demographic Data
Table 4:  Exhaustion as acause of Burnout
Table 5: Depersonalizationas a cause of burnout
Table 6: Accomplishment as a cause of  Burnout

Ethical  Clearance: The study has approval obtained from the UMS FMHS Research  Ethical committee, ref no: UMS/FPSK/6.9/100-6/1/97

Conflicts of Interest: There is no conflict of interest in this study.

Fund for the study: This is self-funded study.

DISCUSSION

Burnout situation experienced by the nursing student was measured through the overall measurement of whether they have experienced it Throughout the yearor Never experienced such a situation. The weighing up of the results was done on three causes of Burnout, namely, Exhaustion, Depersonalization and Accomplishment 11.

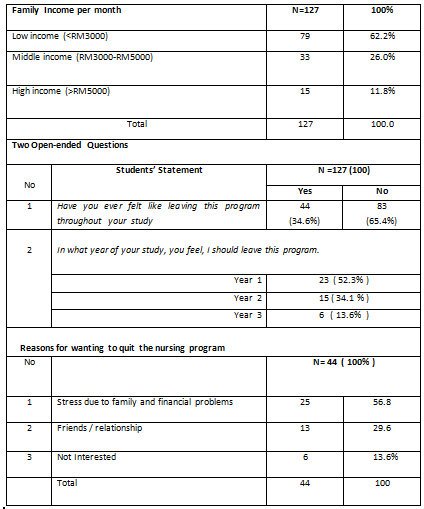
The first analysis of the study was the information on Turnover. Turnover in this study means, students intend to leave the diploma in Nursing program. The results were obtained through 2 open-ended questions. We found that 65.40% of nursing students had the intention to leave the program that transpired them throughout the years of study and 62.0% were from the low-income families with an income of less than RM 3000 per month. This group is quite precisely that ourproclamation from the findings envisaged that it is this group of students that is most likely to experience more stress and Burnout. Student nurses that participated in the threat of financial hardship can lead to less study time with more personal focus and lead to worsening the adverse outcomes10.  With all the above difficulties mentioned, it is understandable students may start to feel uncomfortable with their choice of studies.

The percentage of students who wanted to leave this program was quite obvious,  as students went the higher level, of course,  the desire to leave the program decreases to approximately 50%. The study showed the first year of study was 57% of students wanted to go, followed by 30%   in the second year and  14% in the third year.  Principal reasons for leaving the program were an academic failure, family or personal difficulties, and wrong career choice12.  However, academic failure was no single contributing factor that was thought to make students leave. There are factors such as communication and operational aspects between the university and clinical areas, feelings of not being valued, unmet expectations resulted in student nurses to leave. They also expressed that these factors were of concern to students and appeared to have a cumulative effect that led them to question whether they should continue their education programme.

We found that there is a unique outcome when a comparison of Turnover of this study with a study conducted on trained nurses with the same motive – intending to leave. The comparison of results showed that the longer the nurses in the workplace, the high percentage of them wanting to leave the job. Recruiting & retaining new nurse grads,  the new nurse grad turnover rates are roughly 30% in the first year of practice, and as high as 57% in the second year 9, 10. The new nurses reported that low job satisfaction associated with heavy workloads, disappointment about scheduling, insufficient time with patients, absence of independent practice, and the lack of intrinsic and extrinsic workplace rewards. Poor relationships with peers, managers, and interprofessional colleagues also lead to dissatisfaction.However, most nurses leave their jobs for many reasons, both voluntary, desire for change or promotion, job dissatisfaction, geographical move, returning to school or leaving the nursing profession for good.

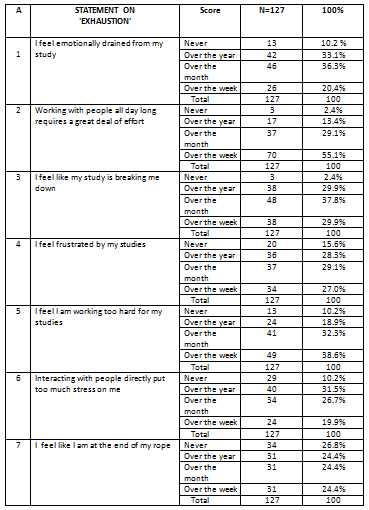
For the analysis on Exhaustion, the results had shown that98% of students claimed they were too exhausted and this makes them feel as if they were breaking down and working with people all day long demanded a great deal of effort especially in the clinical areas. Although as student nurses do not hold the same level of responsibility as qualified staff of heavy workload,  having student status is stressful in itself 13. Perhaps that could be the first sign, and the highest predictor of Burnout is emotional Exhaustion. Most nurses know what it is like to be tired, but emotional Exhaustion leaves the feeling wholly drained as a result of the stress of the job.  It added, among students also, they did not show the burnout syndrome. However, they showed high scores on Emotional Exhaustion factors, which may add up to an early indicator of the development of the burnout process and Exhaustion 15

As we know, moststudent nurses spend half of their programme experience in clinical areas, and it is these placement experiences that caused a massive amount of stress, which sometimes can lead to students discontinuing their programme of study. The initialclinical experience was said to be very stressful, and they experienced more anxiety compared with third and fourth-year students. The fear of working with people all day long requires a great deal of effort,  fearof harming patients, the sense of not belonging to the nursing team and of not being fully competent on registration were mentioned as causes of burnout

They also faced the harsh realities of autonomous university life, the difficulties of transitioning in the basic nursing sciences and the daily dilemmas of dealing with critically-ill patients during their routine clinical placements13.The clinical posts require them to practice full shift hours for about 6 to 8 weeks, and in specific nursing colleges, students don’t see the long holidays as other students do. Due to the hectic schedule, their input into student life is minimal, which often find nursing students have forgotten by universities, Byrne, G &RuffoniS(2016)2.The feeling of Exhaustion, due to their study, made them, especially the new ones began to spend less time at home with family as they start to run shifts during their student’s life. With all the above difficulties mentioned, it is understandable that some of these students may begin to feel uncomfortable with their choice of studies especially if they have the feeling of not coping with the environment and hardiness to survive the coursework. Such sentiments could quickly bring about further an already deadly academic background, which could easily lead to them becoming burnt out 17 · ‎

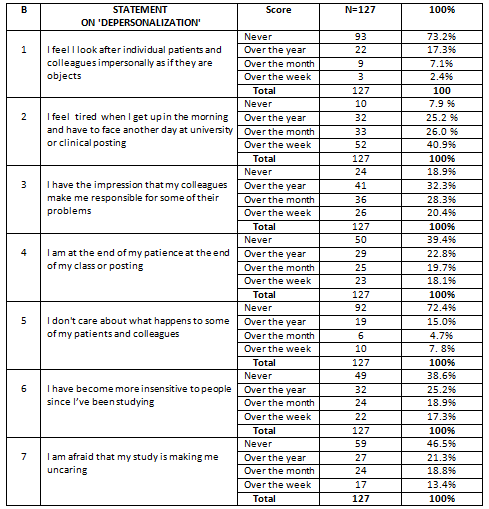
The second element of the course of Burnout among the nursing students was Depersonalization. Generally, the word depersonalization is defined as “unfeeling or impersonal response toward recipients of one’s service, care, treatment, or instruction. For example, a nurse experiencing Depersonalization might not be able to be as empathetic or caring toward a patient dealing with treatment, and this is how Burnout happened. The nurses’ attitude towards patients may be harmful or even heartless or unfeeling and sometimes articulating in unprofessional comments directed at colleagues, feeling nothing when a patient dies, or even blaming patients for their problems. In the case of Depersonalization, it is reported that when ones become so exhausted, they tend to detach themselves from their surroundings. Their outlook may be harmful or even calloused, and it can express itself in unprofessional comments directed at colleagues, feeling nothing when a patient dies, or even blaming patients for their problems.In this study, 117 (92.1%) students felt very tired in the morning to face another day at university or in clinical posting and followed by 103 (81.9%) had the impression their colleagues made them responsible for their problems, and this happened throughout the learning year.The feeling of fatigue in every way, people who are emotionally exhausted often feel like they have lost control of their lives they often reported feeling trapped in their situation, whether it is at work or in an outside relationship. This study also has shown that over 50% of students claimed that they were at the end of their classes or clinical posting; they also have become more insensitive to people since they were studying. They were afraidthat the study was making them uncaring 16.

Nursing students cope with stress in a variety of ways, and many of their coping mechanisms were constructive. However, one of the most common coping mechanisms for the pressures of nursing school leads directly to Burnout: avoidance coping.Avoiding problems is easy. Putting off assignments, leaving things for later, or assuming the future self will take care of everything is easy. Avoidance of coping is the strongest predictor of Burnout in nursing students.  By avoiding problems, students just add to the pile of issues that can potentially leave them in states of distress.What is impressive in this case was, even though students claimed they were too tired and their friends added to the problems, they still respected their friends and patients they cared for and did not consider them asthe objects.  By focusing on the positive outcomes will make us think deep, meaningful motivations, and this helps us insustainingthrough difficult times. The sincere caregiving attitude will make us stronger if we are looking for the silver lining in our career future. The final significant predictor of Burnout is a reduced feeling of Personal Accomplishment. You may not feel that you’re a good nurse or that you make any difference at all in patients’ lives. Nurses working in high-intensity settings, like the ICU or emergency room, may experience this more often as they receive a more significant proportion of cases where little can be done for the patient 14.

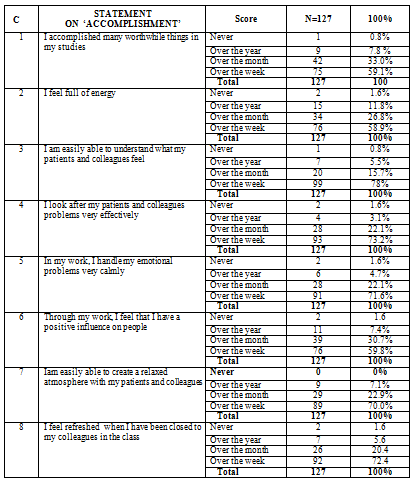
Accomplishment is the last course of Burnout in this study. It has eight elementson intended achievement, and the emphasis was on relationships with peers, the training environment and contentment with the program. Almost all eight aspects received 98.4% excellence. The highest Accomplishment obtained in this study was, the gratitude from students (100%) that they were able to create a calm atmosphere among patients and friends.  Almost all the eight elements found in the aspect of Accomplishment received 98.4% excellence. The highest Accomplishment obtained in this study was, the gratitude from students (100%) that they were able to create a calm atmosphere among patients and friends.  Those findings on the course of Accomplishment were very encouraging.If we look in detail, Nursing Education is education about nobility. Therefore,  it was evident that the results of the Accomplishment received 100%  gratitude from students. The very basic concepts of Nursing education isabout humanity and preserving safety and professionalism.  As for the qualified nurses, they also enrol in continuing education courses that help them gain more profound knowledge of their profession and become better nurses. They do not spend their entire workday locked away and isolated in an office. They work while surrounded by both colleagues and patients, meeting new people each day. They encounter all sorts of individuals, like newborn babies, teenagers with severe illnesses and unique perspectives on life, and elderly patients with end-of-life wisdom, StaffWriters (2020).

CONCLUSION

Burnout experienced due to Exhaustion, 98% of students claimed that they were too exhausted and were flouting down due to the study and working with people all day long demanded a great deal of effort. As for Depersonalization, 92.1% of students felt very tired in the morning to face other days of clinical posting.  However, for the Accomplishment, the highest achievement, 100%of students expressed their gratefulness that they were able to create a calm atmosphere among patients and friends. They were pursuing the program despite the hardships and Burnout due to study, worth the journey. Students in this study(62% ) appeared from low-income families when asked if they had ever felt like leaving the program, 65.4% said ‘No’.  The reluctant to leave the program could be students from the low-income group despite the hardship in life as well as in the study, and they were able to hold on and successfully demonstrated good attitudes to be a nurse. The Nursing institutions of this study is capable of transforminga deprived societyinto good being. To students, pursuing the program despite the glitches worth the fights for upcoming career.

REFERENCES

  1. Bridgeman, P.J., Bridgemen, B.M., &Baroneomin, J (2018). Burnout syndrome among healthcare professionals. American Journal of Health-System Pharmacy, 3(75),147-152.
  2. Morales E. Lived experience of Hispanic new graduate nurses–a qualitative study. Journal of Clinical Nursing. 2014; 23(9-10): 1292-1299
  3. Doulougeri, K., Georganta, K., &  Montgomery, A. (2016). “Diagnosing” Burnout among healthcare professional: Can we find consensus? Cogent Medicine, 3(1),1.
  4.  Flinkman, M., Bouret, I.U.,&Salanterä, S. (2013). Young Registered Nurses’ Intention to Leave the Profession and Professional Turnover in Early Career: A Qualitative Case Study. Hindawi, 2013.1-12.
  5. Hamidah, H., Maziah, M., Ayesha, B., Subahan, T., &SitiRahayah, A. (2012). The Development of a Malaysian Model Internship Programme (MyMIP): A Preceptor Model for Nurses in their Early Stage of Profession. Procedia-Social and behavioural sciences, 64(2012),492-500.
  6. Hong, YK., Kim, YH., &Son, H. (2016). Effect of Nurses’ Incivility Experienced by Nursing Student, Coping. Journal of Korean Acad Nurs Adm, 4(23), 323-331.
  7. Kantek, F. (2010). Why do student nurses leave? Procedia Social and behavioural sciences, 9(2010).1922-1925.
  8. Law B, Chan E. The experience of learning to speak up: A narrative inquiry on newly graduated registered nurses. Journal of Clinical Nursing. 2015; 24(13-14): 1837-1848.
  9. Tsang L, Sham S, Law S, et al. ToUCH Program on competence, occupational stress and self-efficacy of newly graduated registered nurses in United Christian Hospital: A mixed method research study. Journal of Nursing Education and Practice. 2016; 6(8): 129-137
  10. Krejcie, V.R., & Morgan, W.D. (1970). Determining Sample Size for Research Activities. Education and psychological measure, 30(3),607-610.
  11. Parker V, Giles M, Lantry G, et al. New graduate nurses’ experiences in their first year of practice. Nurse Education Today. 2014; 34(1): 150-156.
  12. Mathias, T.C., & Wentzel, D. (2017). A descriptive study of Burnout, compassion fatigue and compassion satisfaction in undergraduate nursing students at a tertiary education institution in KwaZulu-Natal. Curators, 40(1),a1784.
  13. Njim, T., Mbanga, C., Mouemba, D., Makebe, H., Toukam, L., Kika, B., &Mulango, I. (, 2018). Determinants ofburnout syndrome amongnursing students inCameroon: a cross-sectional study. BMC Research Notes, 11(450).1-6.
  14. Ebrahimi H, Hassankhani H, Negarandeh R, et al. Barriers to support for new graduated nurses in clinical settings: A qualitative study. Nurse Education Today. 2016; 37: 184-188
  15. Lea J, Cruickshank M. Supporting new graduate nurses making the transition to rural nursing practice: Views from experienced rural nurses. Journal of Clinical Nursing. 2015; 24(19-20): 2826-2834.
  16. Stimpfel, A.M., Sloane, D. M., & Aiken, L.A (2020). Higher The Levels Of Burnout And Patient Dissatisfaction. Health Affairs, 31(110), 2501-92509.
  17. Tomaschewski, B., Lunardi, L.V., Lunardi, L.G., Barlem, E., Silveirs, R., &Vidal, D. (2014). Burnout syndrome among undergraduate nursing students at a public university. Rev. Latino-Am. Enfermagem, 22(6): 934-41.
  18. Tsang L, Sham S, Law S, et al. ToUCH Program on competence, occupational stress and self-efficacy of newly graduated registered nurses in United Christian Hospital: A mixed method research study. Journal of Nursing Education and Practice. 2016; 6(8): 129-137.
Citation:  

Hamidah H., Mazlinda M., Rosnah M., Azila T., et al. (2020).  Burnout and turnover experience: Behind the noble intention in pursuing the diploma of nursing program  in  a Malaysian institutions of higher learning, ijmaes; 6 (4); 869-882.

Effects of very early mobilization on motor recovery following acute stroke- A Randomized Control Trial

Beena Oommen1, Sapna Koju2

1, 2 Associate Professor, ManjunathaCollege of Physiotherapy, Chokkanahalli, Hegdenagar, Bangalore

Mail id: beena2281@gmail.com                                                                                                      

ABSTRACT

Background of the study: Stroke is defined by the national institute of neurological disorders and stroke as sudden loss of neurological function resulting from an interference with blood supply to the brain. This study aims to know the effects of very early mobilization on motor recovery following acute stroke.

Methodology: The study was conducted among 40 subjects with acute stroke patient, with modified Rankin   scale (MRS) ≥2. The subjects were randomly assigned into two groups equally. Group A (n=20) were given early mobilization which included motor recovery training for 30 minutes and twice in a day within 24-48hours of hospital admission. Group B (n=20) were also given motor recovery training for 30 minutes, twice in a day but only after 72hours of hospital admission. It was done for 6 weeks. Modified Rankin scale, Motor Assessment scale and National institute of health stroke scale pre score was obtained before the intervention and post score after 6 weeks of intervention for both the groups.

Results: The statistical analysis shows that t-value is 1.286 and p-value is 0.206 for modified Rankin scale p>0.05 is statistically not significant.  For motor assessment scale t-value is 3.760 and p-value is0.001 hence p< 0.05 it is statistically significant.  According to statistical analysis of NIHSS score t-value is 0.931 and p-value is 0.358 with p> 0.05 which is statistically not significant.

Conclusion: There was no significant difference between very early mobilization and mobilization after 72 hours. Sothe study concluded that there may not be helpfulon early mobilization for motor recovery in patient with acute stroke.

Keywords: Stroke, Acute stroke motor recovery, very early mobilization, modified Rankin scale, motor assessment scale, NIHSS.

Received on 25th September 2020, Revised on 16th October 2020, Accepted on 18th November 2020 DOI:10.36678/IJMAES.2020.V06I04.003

INTRODUCTION

Stroke is a leading cause of motor and functional impairments; with 20% of survivors requiring institutional care and 15%-30% being permanently disabled. It affects motor and functional task due to which activities of daily living gets affected. The estimated adjusted prevalence rate of stroke ranges from 84-262/100,000 in rural area and 334-424/100,000 in urban areas. The incidence rate is 119-145/100,000 based on the recent population based studies1-4.

One of the major cause of human morbidity and mortality, it was the sixth leading cause of disability-adjusted year in1990 and is projected to rank fourth by the year 2020.WHO has defined stroke as “a clinical syndrome consisting of rapidly developing clinical signs of focal (or global in case of coma) disturbance of cerebral function lasting more than 24 hours or leading to death with no apparent cause other than vascular origin 5-8. Ischemic stroke is due to cessation of blood supply to the brain and it is the most common type and approximately comprises 87% of the stroke cases. Hemorrhagic stroke is occurs due to rupture of weakened blood vessels in or around the brain tissue9-12.

The effects of stroke can be both physical and mental depend on the site and severity of brain injury. The most common Symptoms of stroke are sudden weakness or numbness of the face, arm, leg, most often on the one side of the body, inability to move, confusion, dizziness, dysarthria, aphasia, visual field defect or sudden loss or blurring of vision, dysphasia, problem with balance and co-ordination and may be loss of consciousness13-19.

Objectives of the Study are to determine motor recovery in patient with acute stroke, to determine the effect of very early mobilization on motor recovery following acute stroke and to determine the effect of early mobilization in stroke.

METHODOLOGY

This is an experimental study with randomized control trial. The study population was patients with acute stroke and conducted at Florence College of physiotherapy and research center, also from neuro-specialist hospital, 80 feet road, Bangalore. Sampling method used in this study was simple random sampling. Sample size for the study was 40 and with a duration of study 6 weeks.

Inclusion criteria: Type of stroke: ischemic or hemorrhagic stroke, Age group: 55-65yrs, Gender: Both male and female, Modified Rankin scale ≤ 2, Acute stroke confirmed on computed tomography scanning, Ability to participate in 30 minutes of physiotherapy sessions.

Exclusion criteria: Early deterioration, Documented palliative treatment, Immediate surgery, Another serious medical illness or unstable coronary condition, No response to voice, Systolic blood pressures lower than 110 mm Hg or higher than220 mm Hg, Oxygen saturation lower than 92% with oxygen supplementation, Resting heart rate of less than 40 beats per min or more than 110 beats per min, Temperature greater than 38·5°C, Aphasia, Cognitive impairment, Severe hemi neglect, Previous history of stroke, Not willing to give consent.

Outcome Measures: Modified Rankin scale, Motor assessment scale, National institute of health stroke scale.

Materials Required: Sphygmomanometer, Pulse Oximetry, Wheelchair, Walker, Splint and braces if needed, Data collection Chart, Consent form.
Permission was taken from the Hospital to carry out the study in acute stroke patient. 40 subjects including both male and female, who fulfilled the inclusion criteria and exclusion criteria, were selected for the study. The information sheet about the study and the consent form were given to the subjects for the approval. Subject’s demographic details such as age, gender, occupation, address, phone number, past history, medical history were documented.


A total of 40 patient aged between 55-65 yrs will be selected out of this 20 patient. Group A received very early mobilization and other half 20 patient. Group B received very early mobilization. They will be mobilized only after 72hrs of onset of acute stroke. Patient was acknowledged about the treatment given and their effect on their activities and prior consent will be taken. Group A, did Very Early Mobilization: The patient will receive early mobilization i.e. mobilization within 24 to 48hr after the onset of acute stroke. It includes active exercise of both upper limb and lower limb followed by side lying, side lying to sitting at edge of bed, standing with and without support, walking and sitting in chair or wheelchair.


Group B, did Mobilization after 72hr received mobilization only after 72hr of onset of acute stroke. This also includes same treatment protocol as group A. i.e. active exercise of both upper limb and lower limb followed by side lying, side lying to sitting at edge of bed, standing with and without support, walking and sitting in chair or wheelchair.

Intervention: Group A (n=20) Very Early Mobilization and the subjects were selected which fulfills inclusion and exclusion criteria. Group A were mobilized within 48hr of onset of stroke. Patient in this group were 1st assessed with the outcome measures i.e. MRS, MAS, NIHSS, then the treatment was started which included were PNF stretching, Passive and active movement to maintain joint integrity and mobility, Bridging, Rolling, Supine to sitting, Sitting with support progressed to sitting without support, Side sitting to check balance of lateral trunk and abductor on one side of body, Sitting to standing supported progressed to unsupported, Standing modified plantigrade, Weight shifting activities transfer weight with feet on the floor, Reach out activities, Walking, with frequency of treatment was once in a day for 6 weeks and duration of training lasted for 30 min per day.

Group B (n=20) mobilization after 72hr. Patients were selected considering inclusion and exclusion criteria. Patient in this group were mobilized only after 72hr of onset of acute stroke. Group B also firstly assessed with all three outcome measures are MAS, MRS, NIHSS and treatment was done which included same as given for Group A, with frequency of once in a day for 6 weeks, Duration of the training lasted for 30 min per day.


Procedure for measuring Modified Rankin Scale (MRS): Patient were assessed with modified Rankin scale which consists of score 0-5 where 0 is no disability and 5 is severe disability patients were assessed with MRS before starting the treatment and after the treatment at end of 6th week.
Procedure for measuring motor assessment sale (MAS): During this examination patient were assessed with motor assessment scale in which each item scored on scale of 1-6 with 8 areas of motor function. Patient were assessed depending upon their motor behavior scoring from 1-6 in which 1 is with maximum assistant and 6 is without assistant. Scoring was done according to performance. It was done before treatment and at the end of 6th week.


Procedure for measuring NIHSS: NIHSS helped to find the severity of stroke, it have 11 different component where 0 shows no any severity in condition and 3 and more shows increasing in severity in condition so patient were asked to perform task according to their performance scoring was done before treatment and at the end of 6th week.

RESULTS

AGE GROUP A GROUP B
55 4 3
56 2 1
57 5 4
58 1 3
59 1 1
60 3 2
61 1 1
62 1 2
63 0 2
64 1 1
65 1 0

Table -1: Distribution of subjects with acute stroke according to age in both the groups

The table 1 shows the proportion of subjects with acute stroke according to the age. The age distribution is given as 55 years to 65 years. 55 age group 4 subjects in group A and 3 subjects in group B, 56 age group, 2 subjects in group A and 1 subject in group B. Likewise, age distribution is given for group A and group B.

Graph -1:  Distribution of subjects with acute stroke according to age in both the groups

Table -2: Distributionof subjects with acute stroke according to gender in both the groups

The table 2 shows the gender distribution in both the groups in subjects with acute stroke. In group A, 9(45%) of subjects were females and 11(55%) of them were males. In group B 10(50%) were females and 10(50%) were males. There was no much variation in between the groups according to gender and it was found to be statistically not significant at 5% level ie., p>0.05. It evidenced that the subjects with acute stroke according to baseline characteristic of gender is homogeneous in both the groups.

The following bar diagram shows the proportion of subjects according to gender

Graph -2: Distribution of subjects with acute stroke according to gender in both the groups

SIDE GROUP A GROUP B
LEFT 8 8
RIGHT 12 12

Table -3: Distribution of subjects with acute stroke according to body side in both the groups

The table 3 shows the proportion of subjects with acute stroke according to the body side. In group A, 8 subjects affected in left side and 12 subjects were affected in right side. In group B, 8 subjects affected in left side whereas 12 subjects were affected in right side. So, the given subjects were equally distributed in both the groups in the both the sides.

The following bar diagram shows the proportion of subjects according to the side

Graph 3: Distribution of subjects with acute stroke according to body side in both the groups

Table-4: Comparison of pre and post test MRS scores among subjects with acute stroke on motor recovery among the groups

The above table -4 shows the pre and post test MRS scores among subjects with acute stroke on motor recovery among the groups. The pre test scores of MRS were 1.85± 0.36 and post test was 0.75±0.71 in group A. The pre test scores of MRS were 2.0±0.00 and post test was 1.15±0.58 in group B.

Pre post comparison in MRS shows that the average improvement is 1.1 in group A with the p value 0.00 and in the group B, average improvement is 0.85 with p value 0.00. Any statistical test is said to be significant if P < 0.05. So it can be notice as post comparison group A is also showing significant improvement and group B also shows significant improvement. So, it can be said as group A and group B is showing significant improvement in MRS.

Graph -4: Comparison of pre and post test MRS scores among subjects with acute stroke on motor recovery among the groups

Table-5: Comparison of pre and posttest MAS scores among subjects with acute stroke on motor recovery among the groups

The above table -5 shows the pre and post test MAS scores among subjects with acute stroke on motor recovery among the groups. The pre test scores of MAS were 28.3 and post test was 37.15 in group A. The pre test scores of MAS was 27.1 and post test was 32.35 in group B.

Here, Pre post comparison in MAS shows that the average improvement is 8.85 in group A with the p value 0.00 and in the group B, average improvement is 5.25 with p value 0.00. Any statistical test is said to be significant if (p< 0.05). So, it can be said as group A and group B is showing significant improvement in MAS.

Graph -5: Comparison of pre and post test MAS scores among subjects with Acute stroke on motor recovery among the groups

Table 6: Comparison of pre and post test NIHSS scores among subjects with Acute stroke on motor recovery among the groups

The above table -6 shows the pre and post test NIHSS scores among subjects with acute stroke on motor recovery among the groups. The pretest scores of NIHSS were 7.1 and post test was 2.9 in group A. The pre test scores of NIHSS was 8.7 and posttest was 4.85 in group B.

Here, Pre post comparison in NIHSS shows that the average improvement is 4.2 in group A with the p value 0.00 and in the group B, average improvement is 3.85 with p value 0.00. Any statistical test is said to be significant if (p< 0.05). So, it is concluded that there is a significant improvement in NIHSS in the both of the groups.

Graph -6: Comparison of pre and post test NIHSS scores among subjects with Acute stroke on motor recovery among the groups

Table 7: Comparison of average improvement of the outcome measures among the subjects with acute stroke in between the groups.

The above table-7 represents the comparison of average improvement of the outcome measures among the subjects with acute stroke in between the groups.

In MRS the average improvement is 1.1 in group A and 0.85 in group B with p value 0.206, which was almost similar and statistically not significant (p>0.05). i.e. both the groups have shown the improvement and equally good.

In MAS the average improvement of 8.85 in group A and 5.25 in group B with p value 0.00,which means there is a significant difference in group A and group B (p<0.05). Therefore, as per the value given Group A is highest so comparatively it shows the good improvement.

NIHSS shows the average improvement of 4.2 in group A and 3.85 in group B with p value 0.358, which is almost similar and statistically not significant (p>0.05) i.e. both the groups have shown the equal improvement.

Graph-7: Comparison of average improvement of the outcome measures among the subjects with acute stroke in between the groups.

DISCUSSION

The present study was done to know the effectiveness of very early mobilization on motor recovery following acute stroke. Stroke has been recognized as a common disorder among population. It is a leading cause of motor and functional impairment. Stroke affects motor and functional task due to which activities of daily living gets affected. The effect was evaluated by using MRA, MAS and NIHSS.

This study was  conducted among 40 subjects who were randomly assigned into two groups of each group A(n=20) was given very early mobilization  which include a set of exercise in lying, sitting and standing followed by walking for 30 minutes. Group B (n=20) was mobilized only after 72hr of onset of acute stroke. Both groups were observed for 6 week.

Out of 40 subjects included in the study 9(45%) were female and 11(55%) were male in group A. In group B 10(50%) were female and 10(50%) were male  there was no much variation in between the groups according to gender and it was found to be statistically not significant i.e, it was homogenous in both the groups.

The present study examined the effectiveness of very early mobilization on motor recovery in subject with acute stroke. Pre and post score were evaluated using modified Rankin scale, motor assessment scale and national institute of health science score. Assessment was taken prior to and after the training.

Subject were ranging from 55-65yr, in group A the subject were ranging from 55-65yr with mean and SD 58.3000±2.99297. In group B the subject were ranging from 55-65yr with mean and SD of 58.8500 ± 2.87045. The unpaired t-test was carried to compare the mean which was found to be significant p>0.05. It revealed that the baseline characteristic of age was similar in both the groups.

In the present study Group A very early mobilization shows that pre test modifiedrankin scale mean and SD was 1.8500±.36635. Mean and SD of group B is 2.000±0.000. But in post test group A mean and SD was 7500±.71635. In group B mean and SD is 1.1500±.58714. In comparison to pre and post test group A t-value was 7.678 and p-value is 0.000 i.e P< 0.05 which is statistically significant, this shows that there is significant improvement in motor recovery after acute stroke.

Similarly motor assessment scale (MAS) was also an outcome measure, the MAS shows following statistical values MAS for pre test Group A was mean and SD 28.300±5.56398, post test it was mean and SD 37.15000±7.59692 and group B pre evaluation was mean and SD 27.1000±3.27511 and post evaluation was mean and SD 32.3500±3.97724, t-test and p-test was done to check significance i.e t-value was 10.688 and p-value was 0.000 in group A and in group B t-value was 10.925 and p-value 0.000 here p<0.05 which is statistically significant and shows significant improvement.

NIHSS pre test and post test evaluation score among subjects with acute stroke on motor recovery among the group. The pre test score was 7.1 and post test was 2.9 in group A. the pretest score of NIHSS was 8.7 and post test was 4.85 in group B, here pretest comparison in NIHSS shows that the average improvement is 4.2 in group A with p-value 0.00 and in group B, average improvement is 3.85 with p-value 0.00, any statistical test is said to be significant if p<0.05 so it is concluded that there is a significant improvement in NIHSS in both of the group.

When the comparison of average improvement of the outcome measures among the subject with acute stroke in between group shows, In MRS the average improvement is 1.1 in group A and 0.85 in group B with p value 0.206, which was almost similar and statistically not significant (p>0.05). i.e. both the groups have shown the improvement and equally good.

In MAS the average improvement of 8.85 in group A and 5.25 in group B with p value 0.00,which means there is a significant difference in group A and group B (p<0.05). Therefore, as per the value given Group A is highest so comparatively it shows the good improvement.

NIHSS shows the average improvement of 4.2 in group A and 3.85 in group B with p value 0.358, which is almost similar and statistically not significant (p>0.05) i.e. both the groups have shown the equal improvement.

The study done by Zhumye et al shows similar result  that  early mobilization done to patient with stroke  using  barthel index as outcome measure  with MRS score ≤2  came to a conclusion that further research is required to verify effect of early mobilization in patient with cute stroke 20,21.

Present study done was also similar to the study done by Torum Askim et al studied to assess motor network changes after ischemic stroke in patient treated with VEM  where MRS was less than 3 before admission using mini mental scale  examination score shows that there is change in neural activity in relation to the motor learning and motor recovery . So there should be further emphasized in early motor training after stroke 22, 23.

Lindely RL et al also did study in very early mobilization after stroke to know efficacy and safety of the very early mobilization in both hemorrhagic and ischemic stroke where pt were mobilized within 24-48hr was associated with reduction in complication and in odds of favorable outcome gave a conclusion that VEM is effective in practice 24, 25.

Antje S et al research was also similar to the present study which shows that RCT IN very early mobilization in patient with acute stroke has shown improvement in neurological functioning and motor recovery they also had used NIHSS scale to evaluate the improvement in subject 26.

The present study shows that it is statistically not significant so generates an alternative hypothesis i.e very early mobilization on motor recovery after stroke may not shows any improvement during study which is similar to study done by Yelnik P et al that very early active mobility after stroke where patient with acute stroke receives intensive physiotherapy for 45min daily and after study they found that VEM after stroke may not be efficient in impressing motor control 27.

 Another study by stott D et al did a pilot RCT  in which they found that stroke patient if receive good care in initial days  they are more likely to make good recovery  and those who receive early mobilization can  be benefited and they achieve walking soon without immobilization complication 28.

Above study proves that there may be or may not be an improvement in motor recovery in subjects with acute stroke. While comparison of  pre test and post test   for motor recovery  in acute stroke between the group  the pre test score  of (MRS) modified  rankin scale  t-value 1.286 and p-value 2.06  i.e P> 0.05 which is statistically not significant.  (MAS) motor assessment scale  when compared between the group showed t-value 3.760 and p- value 0.01 which  is statistically significant  that  there was  improvement in motor assessment scale in patient with acute stroke. T-value and p- value for NIHSS scale improvement was evaluated where t-value was 0.931 and p-value 0.358, i.e. P> 0.05 which is statistically not significant.

Ethical Clearance: Ethical clearance has obtained from Florence College of Physiotherapy, Bangalore to conduct this study with reference number: FCP/IRB/85,Dated 20/04/2017.

Conflicts of Interest

The author declares that there is no competing interest on conduct of this study and in publishing this article.

Fund for the study: This is self-funded study.

Limitation of study: Sample of the study was limited to a group of 55 to 65 years. Individual learning ability, motivation and cognitive process acts as confounding factors hence may have affected the results. Duration for which the flexibility was maintained post intervention was not studied.

Suggestions & further recommendations: Long-term study can be done. Special attention can be done for the follow–up. Only 40 subjects were obtained. The sample size was small; hence effect seen cannot be generalized.

CONCLUSION

The result of the present study showed that there was no significant difference in the effect of VEM on motor recovery following acute stroke and patient mobilized after 72hrsof onset of stroke. Hence the study accepts null hypothesis and rejects alternate hypothesis.  It is concluded that very early mobilization may or may not be helpful for motor recovery in patient with acute stroke.

REFERENCES

  1. Sunil G. Harsulkar, Keerthi Rao et al: (2013). Effectiveness of Gong‟s Mobilization on shoulder abduction in adhesive capsulitis: A Case Study. Indian Journal of Basic & Applied Medical Research; September Issue-8, Vol.-2, P. 984-989.
  2. RavinaTaragi, Dr. Siddhartha Sen and Dr. Sonia Khurana (2014). Combined effect of soft tissue mobilization with PNF on glenohumeral range of motion and overhead reach in frontal plane along with pain perception .Int J Advanced Research (2014), Volume 2, Issue 1, 578-586
  3. SoungYob R, Wi-Young (2014). Analysis of Range of Motion and Isokinetic Strength of Internal and External Rotation According to Humeral Retroversion of the Dominant Shoulder in Youth Baseball Players, Iranian J Publ Health, 43: 178-184.
  4. Sonakshi Sehgal, Siddhartha Sen, Amit Dhawan (2016). Effects of Muscle Energy Technique in Increasing Range of Motion and Strength of Glenohumeral Internal Rotator, in Athletes with Glenohumeral Internal Rotation Deficit. American Journal of Sports Science. American Journal of Sports Science; 4(2): 43-48
  5. Burkhart S.S, Morgan C.D, Kibler W.B. (2003).The disabled throwing shoulder: spectrum of pathology, part I: pathoanatomy and biomechanics. Arthroscopy. 19((4)): 404–420.
  6. Kibler WB Burkhart SS, Morgan CD (2003).The disabled throwing shoulder: spectrum of pathology. Part II: evaluation and treatment of SLAP lesions in throwers. Arthroscopy. 19: 531-539.
  7. Stephanie D. Moore, Kevin G. Laudner, Todd A. Mcloda (2014). The Immediate Effects of Muscle Energy Technique on Posterior Shoulder Tightness, 2014 Journal of orthopaedic & sports physical therapy; 41: 400-407.
  8. Michael R. Borich, (2006). Scapular angular positioning at end range internal rotation in cases of glenohumeral internal rotation deficit, J Orthop Sports PhysTher; 36(12): 926-934.
  9. Jinyoung Lee, Li-Na Kim, Hongsun Song, Sunghwan Kim (2015). The Effect of Glenohumeral Internal Rotation Deficit on the Isokinetic Strength, Pain, and Quality of Life in Male High School Baseball Players, Ann Rehabil Med; 39(2): 183- 190.
  10. B. Chakradhar Reddy, Santosh Metgud (2014). A randomized controlled trial to compare the effect of muscle energy technique with conventional therapy in stage ii adhesive capsulitis, Int J Physiother Res; 2(3): 549-54.
  11. Ballantyne F, Fryer G, McLaughlin P. (2003). The effect of muscle energy technique on hamstring extensibility: the mechanism of altered flexibility. J Osteopath Med., 6: 59-63.
  12. Kevin G Laudner, Robert C Sipes, and James T Wilson, (2008). The Acute Effects of Sleeper Stretches on Shoulder Range of Motion. Athl Train., 43(4): 359–363.
  13. Jakson K joseph, Sunish A.V. (2013). The Immediate Effects of Sleeper Sretches on Shoulder Range of motion in Volleyball Players.  Innovative Journal of Medical and Health Science 3: 4 ; 171 – 176.
  14. EdrishSaifee Contractor1, Dhara Santosh Agnihotri, Ronak Mukeshbhai Patel (2016). Effect of Spencer Muscle Energy Technique on pain and functional disability in cases of adhesive capsulitis of shoulder joint. IAIM, 3(8): 126-131.
  15. D L Falla, S Hess, C Richardson (2003). Evaluation of shoulder internal rotator muscle strength in baseball players with physical signs of glenohumeral joint instability, Br J Sports Med; 37: 430–432.
  16. Cools A M, Johansson FR, Cagnie B, Cambier DC, Witvrouw E E. (2012). Stretching the posterior shoulder structures in subjects with internal rotation deficit: comparison of two stretching techniques. Shoulder & Elbow ;4(1):56–63.
  17. Richa Mahajan, Chitra Kataria, Kshitija Bansal (2012). Comparative effectiveness of Muscle Energy Technique and static stretching for treatment of subacute mechanical neck pain, International Journal of Health and Rehabilitation Sciences; 1 (1): 16-23.
  18. Myers JB, Laudner KG, Pasquale MR, Bradley JP, Lephart SM. (2006). Glenohumeral range of motion deficits and posterior shoulder tightness in throwers with pathologic internal impingement. Am J Sports Med. 34: 385-91.
  19. Moore SD, Laundner KG, Mcloda TA, Shaffer MA. (2011). The immediate effects of muscle energy technique on posterior shoulder tightness: a randomized controlled trial. J Orthop Sports PhysTher. 41(6); 400-7.
  20. Aldridge R, Guffey JS, Whitehead MT, Head P. (20120. The effects of a daily stretching protocol on passive gleno humeral internal rotation in overhead throwing collegiate athletes. Int J Sports PhysTher; 7(4): 365-71.
  21. MitChell UH, Myrer JW, Hopkins J, Hunter I, Feland JB, Hilton S C. (2007). Acute stretch perception alteration contributes to success of the PNF “contract-relax” stretch. J Sports Rehabil; 16: 85-92.
  22. M. Seshagiri Rao, Swathi Tejitha (2016).Comparison of 3 stretching protocols for posterior shoulder tightness in throwers. International Journal of Physiotherapy and Research, Int J Physiother Res Vol 4(2):1429-35.
  23. Juneja H, Verma, S. K., Khanna (2011). Isometric Peak Force of Shoulder Rotators in Cricketers with and without History of Shoulder Pain, Journal of Exercise Science and Physiotherapy; 7 (1): 42-49.
  24. Jacquelyn M. Downar; Eric L. Sauers, (2005). Clinical measures of shoulder mobility in the professional baseball player, Journal of Athletic Training; 40(1): 23–29.
  25. Leandro Anonietti, Natalia Luna, Gabreil Nogueira et al., (2014). Reliability Index of inter- and intra-rater of manual goniometry and computerized bio-photogrammetry to assess the range of motion of internal and external shoulder rotation, Medical express; 1(2): 95-99.
  26. Mark G Grossman MG, A Cadaveric Model of the Throwing Shoulder (2005). A Possible Etiology of Superior Labrum Anterior-to- Posterior Lesions, J Bone Joint Surg Am; 87 (4): 824-831.
  27. Donatelli R, Ellenbecker T.S, Ekedahl S.R, Wilkes J.S, Kocher K, Adam J. (2000). Assessment of shoulder strength in professional baseball pitchers. J Orthop Sports Phys Ther. 30 (9) : 544–551.
  28. Manske RC, Meschke M, Porter A, Smith B, Rei­man M. (2010). A randomized controlled single-blinded comparison of stretching versus stretching and joint mobilization for posterior shoulder tight­ness measured by internal rotation motion loss. Sports Health. 2: 94-100.

Citation:

Beena Oommen, Sapna Koju (2020). Effects of very early mobilization on motor recovery following acute stroke- A randomized control trial, ijmaes; 6 (4); 854-868.

Postpartum contraceptive practice and barriers to its use among mothers from a tertiary hospital in Abuja, Nigeria

Ochala Ejura Jennifer1, Rauf Ibrahim2,Samsiah Mat3, Syed Ali Gulab Jan4

Authors

1Graduate, School of Nursing, MAHSA University, Malaysia, Senior Nursing Officer, Federal Medical Centre Abuja, Nigeria, West Africa,

Email: ejujennifer@yahoo.com

2Department of Statistics, Faculty of Science, University of Abuja, Nigeria, West Africa.

Email id: rauf.ibrahim@uniabuja.edu.ng

4Professor, M.N.R. College of Nursing, Narsapur Road, Fasalwadi, Sangareddy, Telengana, India

Corresponding Author           

3Associate Pofessor, School of Nursing, MAHSA University, Selangor, Malaysia

Email Id: samsiah7381@gmail.com

ABSTRACT

Introduction: Nigeria is the 4th highest contributor to global maternal mortality; many postpartum mothers do not initiate contraceptives early and are at increased risk of unplanned pregnancy and abortion. Understanding the barriers is thus vital. This cross-sectional quantitative study carried out at a tertiary hospital in Abuja to determine the contraceptive practice level, identify barriers to use among mothers with infants less than 12 months.

Methodology: Questionnaires were administered on 220 consenting mothers; data analyzed using SPSS software version 25. Descriptive analysis included frequencies and percentages, the inferential statistical techniques used are binary logistic regression to establish the relationship between variables — the p-value set at 5% level, thus p<0.05 is termed significant.

Results: 200 questionnaires were retrieved; the mean age of the respondents was 31; most had tertiary level education, were in monogamous union and Christians. Over-half is within 3months postpartum and desired to have below four children. The commonly used methods are the condom, IUD, pills and implant. 48% are currently on a method, and 1% less have good contraceptive practice. Identified barriers are personal information and health system barriers. Barriers associated with the health system found to impact on the use of contraceptives (p=0.028). Contraceptive use was dependent on respondent’s religion (p=0.050) and child’s age (p=0.038).

Conclusion: Contraceptive practice level of respondents is less than average and child’s age and religion determined it, the mothers are indifferent on personal information and family/cultural barriers, but concerned on health system barriers. Tackling health system barriers in the postpartum period through early education, counseling, opening and equipping more family planning clinics and health facilities can improve contraceptive use.

Keywords: Contraceptive practice, Barriers, Postpartum mothers

Received on 25th September 2020, Revised on 16th October  2020, Accepted on 18th  November 2020

DOI:10.36678/IJMAES.2020.V06I04.002

INTRODUCTION

Family planning involves a conscious decision by persons in the reproductive age group to control space or limit childbirth. Globally, the challenge associated with high birth rate is enormous. International reports show that 190 million women of reproductive age do not want to get pregnant yet do not employ any modern contraceptive method. Meeting the Sustainable development goal (SDG) 3.1 and 3.7 of reducing maternal mortality and increasing proportion of women with satisfied contraceptive need plus increased access to reproductive health service might be a mirage with non-use of contraceptives 1, 2 .

Increased access to contraceptives in the post-delivery period can increase the gains of reduced maternal mortality, unintended pregnancies, associated induced abortions and the proportion of high-risk pregnancies. It is also capable of reducing the already heightened pressure on Nigeria’s resource and produce direct benefit on social, health and financial investment 3,4,5.

The estimates (2000-2017) shows Nigeria is the 4th highest contributor to maternal mortality rate (MMR) in the world after Sierra Leone, Chad and Sudan at 917 per 100,000 live births and has witnessed a marginal 24% change in MMR between 2000 and 2017; this reflects the quality of maternal and child care provided 6, 7.

 The Federal Ministry of Health Nigeria set 2014-2018 as the period to double the contraceptive prevalence to 36%. There appeared marginal increase in the west (Lagos) and north (Kaduna) howbeit only 15.6% of women within 15-49 years use any method of contraception, 23% of women in the north central zone have an inter-pregnancy interval of less than 23months, yet 23% do not want to have more children 8,9, 10.

Moreover, research done in Abuja revealed contraceptive use among women is below average (38-42%) whereas there are reports of unintended pregnancy (16%) with 80% having misconception and fears about the modern methods4,11,12.  There appear a widespread fear of side-effects, misconception and social restriction regarding contraceptive use among women. They desire to make a rational decision about family size and timing of pregnancy, however, are constrained by lack of spousal consent, cultural, religious and educational inhibition 13, 14.

Thus, the need to investigate and delineate contraceptive practice level and barriers associated with input from the mothers in a health facility that offers this service in Abuja. This study aims to investigate the contraceptive practices, specific barriers to utilization of contraceptives among women within 12months after delivery.

METHODOLOGY

This study is a descriptive, cross-sectional study to evaluate the practices, barriers, to contraceptive use among mothers attending the immunization clinic of the University of Abuja Teaching Hospital (UATH), Gwagwalada. The accessible population is about 1,960 Nigerian mothers 18-49 years with an infant below 12months attending the immunization clinic of UATH, based on the average yearly register of the clinic.

The sample size determined used formula 15 for a single proportion

The contraceptive prevalence rate of 15% obtained from the Nigerian national demographic health surveywas used to obtain the sample size for the study (196). Additional 10% of the calculated size added to take care of non-response, bringing the total sample to 220 mothers 10.

The systematic sampling method was applied to draw a representative random sample. The immunization register served as the sample frame for every 9th mother. Subjects comprise women within 18-49 years with infants below 12months who gives consent and is willing to participate in the study. The study had a 90% return rate from 200 properly filed and returned questionnaires.

A structured questionnaire pretested and validated with reliability determined at Cronbach’s alpha 0.79 elicited responses on demographic variables, reproductive history, current and past contraceptive practice, barriers to use. The tool had a total of 48 items in 4 sections. The data collection was by self-administered questionnaire method by the researcher with the help of 1 trained assistant for one month.

After data cleaning, sorting and coding, the analysis was by Statistical Package for Social Sciences (SPSS) Version 25.0. Descriptive analysis and binary logistic regression to establish the relationship between variables with the p-value set at 5% level, thus p<0.05 is termed significant.

Ethical approval obtained from the review board of the UATH, the participants were educated, giving assurances of anonymity and confidentiality of their response and required to tick the consent form indicating consent for the study

RESULTS

Table 1: Socio-demographic characteristics of Mothers attending UATH Abuja

Table 1 presents the socio-demographic characteristics of the 200 respondents; the mothers had a mean age of 31.12. Two-third of the mothers (67.5%) were within the ages of 28-37years, many of the respondents were in a monogamous marriage (89.9%) above two-third had tertiary level of education (67.8%), while about 41% of the mothers were self-employed. 71.4% were Christians and over a quarter (28.6%) were Muslims.

Reproductive History of the Mothers attending UATH Abuja

Figure 1: Reproductive characteristics of the mothers attending UATH

Figure 1 presents the reproductive history of the subjects. A majority (83.5%) have been pregnant between below four times while 17% have had above five pregnancies.  About two-fifth (n=82) reported having a history of abortion, while four-fifth (81.7%) have had 1-2 abortions, and above half of the infant (53.3%) were 1-3months old, more than half (58.8%) of the subjects had 1-2 children while 6% had above 5.

On the number of children desired by the women, about two-third wanted 3-4 children, 27.5% desired above 5, whereas one-third (33.5%) reported their husbands desired above five children. One-fourth (25%) of the subject does not want to have more children while 34.5% would wait for two years after last delivery to have another child, close to two-thirds of the subjects gave an ideal inter-pregnancy interval.

Over half of the respondents (52.5%) indicated that they had not resumed their menstrual cycle after the last delivery while 73.5% have commenced sexual activity after last delivery, of which more than half (58.5%) commenced 1-2 months after delivery.

Table 2: Contraceptive practice of the mothers attending UATH Abuja

The analysis on table 4 revealed 70.5% (n=141) of the respondents had used a form of contraception in the past, over half (56%) used the method about one year whereas 51% did not use it between all pregnancies. Of the 200 mothers, less than half 48% are currently using a method of contraception.

Of the 96 mothers currently using a method over one-third (34.4%) are using a condom, 16.7% use IUD, while 13.5% practice calendar/safe period. Almost half of the mothers (49%) started their method of contraception within 2months of delivery, three-fifth (60.4%) are consistent with practice while more than half (55.2%) consistently breastfeed to prevent pregnancy. Less than half of the mothers (47%) classified as having a good level of practice following analysis of their reported practice while over half (53%) have a poor level of practice.

Figure 2: Current contraceptive type by use

Binary Logistic Regression Model showing association between contraceptive practice level with socio-demographic characteristics of mothers attending UATH

Table 3: Test Results

The Wald statistic has chi-square distribution which is significant at p<0.05. Therefore, any predictor variable that has p-value less than 0.05 is significant. Looking at the equation, it showed that the predictors except for religion are all not significantly predicting contraceptive practices among mothers in UATH since its p-value exceeded the 5% level of significance.

Only the predictor Respondent Religion of Muslim and Christian had a significant impact on contraceptive practices among mothers in UATH with p-value of 0.050. However, since the Respondents religion is significantly impacting on the use of contraceptives by women, the Exp (B) or the Odd ratio will be meaningful, implying that the Christian mothers have odds of using contraceptives that are 2.119 of the odds of the Muslims mothers. It means that the Christian respondents are more likely than Muslim mothers to use contraceptives since the Odd ratio of 2.119 is greater than 1 (2.119>1).

Consequently, rejecting the assertion there was no significant relationship between socio-demographic characteristics of mothers and their use of contraceptive.

Binary Logistic Regression Model showing the relationship between Contraceptive practice level and some reproductive characteristics of mothers attending UATH Abuja

Table 4: Test Results

The Wald statistics results provided an index of the significance of each predictor variable in the equation. Wald statistics have chi-square distribution which is significant at p<0.05. Therefore, any predictor variable that has p-value less than 0.05 is significant. The equation showed that the only the predictor “age of the child” that has a significant impact on CP since the p-value of 0.038 is less than 0.05. Hence, one can conclude by saying that the age of the child is responsible for the use of contraceptives by mothers attending UATH.

All other variables are all not significantly predicting CP among mothers in UATH since its p-value is higher than 5% level of significance. However, History of Miscarriage/Abortion, Number of Missed abortions and Desires children by the wife are statistically significant at 0.1 (10% level of significance) since there p-value is less than 0.1. 

Consequently, the assertion that there is no significant relationship between the reproductive characteristics of mothers and the use of contraceptive is not accepted.

Table 5: Perceived barriers of mothers attending UATH Abuja

As seen from the percentage table above, one-fifth (21.5%) of the respondents agree that information provided in the clinic on contraceptives in the hospital is hard to follow, half (50%) indicated contraceptives disturbs their sexual life, two-third (66%) are concerned about side- effects, the experience of friends influenced nearly half. In contrast, over two-fifth (42%) are not.

From the sectional mean on the variable “Personal information barrier” (PIB) obtained is 3.04 (Neutral), this strongly suggests that the respondents are somewhat indifferent about the challenges associated with personal information on contraceptive use and practices.

Furthermore, on the barriers associated with family and cultural factors, over half (57.5%) of the mothers reported their husband takes contraceptive decisions, more than one-third (35%) do not get financial support from the husband. In comparison, 23.5% and 24.5% indicated they do not have cultural and religious support to use contraceptives. The sectional of 2.62 (neutral) suggest that the respondents are indecisive. Thus, making the barriers from family and culture are not too much a determinant of contraceptive use or practices.

However, 16% indicated preferred method was not always available; one-tenth (10%) could not afford preferred choice, family planning clinic was not accessible 15% subjects, and 28.5% cannot access alternative contraceptive choices. The sectional mean obtained from the variable “Health system barrier” (HSB) is 3.71 (Agree), implying that barriers associated with the health system strongly impact on the use of contraceptives by the respondents.

Table 6: Binary Logistic Regression Model showing the Relationship between contraceptive practices and the barriers to contraceptive practices among mothers attending UATH Abuja

The analysis showed that logistic regression was significant (X2=7.698, df=3, p=0.053); this implies that PB, FCB, and HSB influenced the contraceptive practices (CP) at 5% level of significance. Nagelkerke R Square result revealed that 50% (0.500) of the variability in the contraceptive practices that was explained by PB, FCB, and The results in the model summary showed that the predictors used to predict contraceptive use by mothers are effective.  Also, the result of the overall percentage accuracy value of 70.4% exceeded the standard limit of 56.6%, which implies that the logistic regression model was instrumental in the explanation of the CP and factors influencing it. 

Table 7: Test Results

The Wald statistics results provided an index of the significance of each predictor variable in the equation. Wald statistic has chi-square distribution which is significant at p<0.05. The results showed that only HSB (X2=5.658, p<0.028), significantly predicted the CP. Other predictor variables in the model did not contribute significantly to CP (p>0.05), thereby rejecting the hypothesis.

DISCUSSION

The results showed that over 80% of the respondents were in the 23-37 age groups and had a mean age of 31, a standard deviation of 4.849. This result is similar to previous studies and another covering six states in the south of Nigeria12, 11, 16, 17. Reproductive activity is highest in this group with the heightened expectation for contraceptive usage 18.However, the mean age of respondents in Sudan appeared higher compared with lower age reported in this study 19.

There were more Christians (71.4%) in monogamous marriages (89.9%), over two-thirds (67.8%) had tertiary level of education whereas two-fifth are self-employed. The higher mean age and level of education shows more women are taking to education, thus delaying the age childbearing. Mothers in this study have a higher level of education compared to findings in various parts of Nigeria 20, 17,21. It confirms the rising educational attainment of women in the country as seen in the demographic health survey 10 .

Most mothers (94%) had below four children; this is higher compared to 59% in the Southeast but lower compared to 57.8% with above five children in Northwest Nigeria17,16 .The mean number of children is also lower compared to that obtained in Kenya and Malawi22,23 .The mean parity in this study is lower than the national total fertility rate of 5.5, and that of the north central zone of 5.3 signifying a downward reduction in childbirth in the zone 10.

The parity of the respondents seems to correspond with their desired number of children; this is a welcomed development when women begin to adopt a way of “living” and “thinking” that supports responsible decisions to promote their health and wellbeing. On the other hand, they might not have reached the saturation point to want to stop childbearing, thus providing evidence of contraceptive need.

While more than half of the respondents (52.5%) indicated that they had not resumed their menstrual cycle after the last delivery, 73.5% indicated they had started the sexual activity. The finding appears higher compared to 67.9% who resumed in 8 weeks in Kano-Nigeria, 65.1% in Ethiopia after two weeks but lower compared with 80% resuming in 2-3months without contraceptives in Malawi 21,22,24 .

Over half of the mothers are below three months postpartum, above half gave an ideal inter-pregnancy interval with a quarter have no intention for future childbirth while 61% wish to space for above 2years. The real need for contraception is for those who have no future intention and those needing to delay pregnancy.

Moreover, of 82 (41%), mothers with a history of abortion, almost two-third (61%) have had one abortion, nearly two-fifth (39%) reported 2-3 incidences, this finding is higher compared to a study where 24% had an unintended pregnancy, and 19.2% had a history of abortion 25. There is evidence of contraceptive usage gap. The implication is the increased pregnancy and abortion risk; this confirms the 16% cases of unwanted pregnancy reported in the same center is yet to receive the needed attention, and the figure is rising 4.

The analysis of results revealed that below half current users (47%) had right contraceptive practice level compared to above average (53%) with poor practice. Findings indicated that less than half the mothers (n=96, 48%) currently apply a method although almost three-quarter (n=141, 70.5%) have used a method of contraception in the past.  This result is similar to that in Ethiopia and Ghana 14, 26 but higher compared to findings (45.8%) of Berta et al 24, howbeit one study in South-western Nigeria report higher percentage 20. This study’s subjects with good practice level contrast with 11% two reportedas only 22.9% are current users. Consistent contraceptive use complemented by exclusive breastfeeding increases practice level, benefits the mother, baby, family and the community 6, 25.

This research’s practice level (47%) is higher than the national average of 15% this could be explained by the setting; facility-based, urban-setting which might influence the use or intention to use a contraceptive. Observation during the period of the study showed that more women visited the family planning clinic after filling the questionnaire; the study served as a source of information and reminder for those who had forgotten.

The most common method used by the respondents is the condom (34.4%), though 42.7% use a modern method; one-fifth of the mothers use the natural method. The commonly used modern methods are IUD, oral pills and implants. Close to half of the mothers confirmed the use of condoms by their husbands which corresponds with the mother’s method (condom), a good observation that the men are participating in family planning. Attention should be paid proper use for maximum dual benefit. Some authors corroborate the results and that more women use the condom 17, 20.

The logistic regression analysis for contraceptive practice and all the social-demographic characteristics of the mothers was not significant, except for the respondent’s religion. This finding is consistent with studies in the north and west of Nigeria where religion, marriage and ethnicity showed association with contraceptive use16, 20.

 It is noteworthy that only 18.6% of the cumulative reproductive characteristics of the mothers’ contraceptive use/practice. Only the predictor “child’s age” had a significant impact on contraceptive practices among mothers in UATH (p=0.038). One-fourth with infants less than six months are current users, more (37.7%) are not. It is conspicuous that those with younger children use long-acting reversible contraceptive and four mothers had a bilateral tubal ligation. These methods offer the highest protection against unplanned pregnancy in addition to reduced menstrual bleed and cancer protection.

On the other hand, history of Miscarriage/Abortion, Number of Missed abortions and desired children by the wife are statistically significant at 0.1 (10% level of significance). 

Children desired by wife had a significant relationship with contraceptive use (x2=3.370, p<=0.066). More mothers have an average of 3 children and most (with their husbands) desire 3-4 children, this contrast with a Malawian study with more women desiring more than five children 22. A study in Nigeria confirms the independence of parity with use; a decline in fertility could be responsible for the trend. The desire for fewer children in this study shows an unprecedented decline from the previous findings 5.7 between 2003-2008, 5.5 in 2014 (5.3 in Abuja) 10.

Comparatively, history and number of abortions revealed a statistical relationship with contraceptive use (p=0.067 and p=0.095) Signifying as the history of abortion increased, a corresponding increase in the number of abortions and contraceptive usage occurs. Howbeit, over one-third mothers with a history of abortion are current users. Women do not have to experience an abortion before adopting contraceptives.

Two-third (66%) of the respondents confirmed they had fear concerning side-effects, about half agreed to been influenced by experiences of friends and neighbors. Fear of side-effects, as reported in literature across Nigeria, ranged from 14.6% in Western to 50.3% in the South and 58.8% in the Northern region16,17,20.On the contrary, this population expressed more fears and a better understanding of contraceptives compared to those references above. About 43%respondents in Ethiopia indicated fear of side-effects prevent their use of contraceptives, but a more recent study in Ethiopia presented lower results 24% and 34.6% in Egypt 24.

Concerns about side-effects could be related to contraceptive knowledge, level of education and understanding of the information given by the healthcare practitioner. Albeit 71% affirmed they understood contraceptive information given at the clinic. A study reported the opposite; the subjects had a less contraceptive phobia. The mothers have a higher level of education but seem to be more apprehensive using contraceptives 14.

About two-third pinpoint, the decisions are taken solely by their husbands; over a third had financial support for its use while 21.5% of family members do not support contraceptive use. In like manner, 33.3% of participants in Abakalike, 1724% in Ethiopia, 24 25% in Sudan 19 indicated a lack of spousal consent as a barrier. Howbeit 81.9% of respondents in Ghana got financial support from their husbands, while 5.2% think the contraceptive decision should lie with the husband.[26]Though three-quarter of the mothers reported they could afford contraceptives, one-third are not empowered (unemployed, house-wife and student), when the husbands do not finance contraceptive use, it is a subtle barrier that is downplayed by the respondents.

Over one-fifth and 26.5% of the mothers agree that their culture and religion prohibit the use of contraceptives and religion determined (p=0.050) contraceptive use results are close to this study with 18% and 15% having cultural and religious barriers. However, a higher report 39% and 50.6% have reported for the socio-cultural and religious barrier. Impliedly, religion, community, and cultural affiliations determine the reproductive activity of mothers.

The majority (96%) think the HSB was not strong enough to prevent the use of contraceptive. Unavailability of choice with having to return for refill by of the participants is a significant constraint. Same was reported in a facility-based study, while adding information gap and provider attitude as a challenge. Though health providers may give required information during health talk, the ability to elicit responses about clarity may be a crucial factor preventing uptake. Some participants identified problems of having to interact with the source of information, the pattern of presentation and health literacy as a hindrance13. Therefore, it is not surprising as this study population were reluctant in identifying health professionals as a barrier been that the researcher is one of them. 

In summary, the respondents appear indifferent about the challenges associated with personal information on contraceptive use and practices. The sectional mean reflected as neutral (3.04), while the mothers appeared undeceive regarding family/cultural factors (2.62).  However, the sectional mean obtained from the variable “Health system barrier” is 3.71 (Agree), implying that barriers associated with health system strongly impacts and determine the use of contraceptives by the respondents. Report of many authors confirms this finding 13, 26. To conclude, the regression analysis confirmed HSB strongly determine contraceptive use (X2=5.658, p<0.028).Other predictor variables in the model did not contribute significantly to CP (p>0.05), thereby rejecting the hypothesis.

Ethical Clearance: Ethical clearance has obtained from University of Abuja, Teaching hospital, Nigeria, West Africa, to conduct this study with reference number: UATH/HREC/PR/2019/005,Dated 20/08/2019.

Conflicts of Interest

The author declares that there is no competing interest on conduct of this study and in publishing this article.

Fund for the study: This is self-funded study.

CONCLUSION

This research has shown that 48% (96) of the women are currently using a form of family planning out of which only 41.7% use modern contraceptives and 19.1% follow the natural method. The most common method used by women is the condom.

Majority of the mothers reported being concerned about side-effects but were not bothered by the concerns of family and neighbors; they confirmed understanding and knowledge of contraceptive education given in the hospital. The mothers were indifferent on personal information barriers; howbeit, the health system strongly impact on the use of contraceptives by the respondents.

The contraceptive practice is not dependent on any of the social characteristics of the mothers except for religion; Child’s-age predicted contraceptive use; an important feature is that women with younger children use long-acting contraceptives. Therefore, encouraging women early in postpartum will likely produce more compliant contraceptive users.

Practice Implications

Healthcare providers have to provide contraceptive education at every contact with all women of reproductive age. Nurses must avoid judging the level of contraceptive knowledge based on the educational attainment of their client. Nurses must elicit the method-specific knowledge from each client during counseling in order to give accurate information, dispel misconception and advice on how to seek help for side effects. To achieve this, health workers must take part in training and retraining to remain competent providers.

The reduced fertility desires recorded in this study is a welcomed development, effort must be intensified on the part of the government and health providers to sustain it with more facilities for family planning and trained staff.

Limitations of the study: The researcher observed the following limitations to the study:

This study set does not allow sampling of more indigenous mothers in the city. The researcher recommends future study with a larger sample from various settings to increase its generalizability.

Agida T., Akaba G., Ekele B. and Adebayo F (2016). ‘Unintended pregnancy among antenatal women in a tertiary hospital in North Central Nigeria’, Niger Medical Journal; 57(6):334-338.

  1. Agida T., Akaba G., Ekele B. and Adebayo F (2016). ‘Unintended pregnancy among antenatal women in a tertiary hospital in North Central Nigeria’, Niger Medical Journal; 57(6):334-338.
  2. Saleh, S., Raji, M., Oche, M., Tunau, K and Kaoje, A (2018).‘Socio-demographic Factors Associated with Knowledge and Uptake of Family Planning Among Women of Reproductive Age in a Rural Community of Abuja, Nigeria’, Journal of Sains Kesihatan Malaysia 16(1): 71-79.
  3. Onuorah, W and Jamda, A (2017). ‘Knowledge and Beliefs Regarding Contraception among Married Women in Gwagwalada, Abuja,’Nigeria Journal of Advances in Medicine and Medical Research 23(12): 1-12.
  4. Yidana, A and Sharif, A (2018). ‘Family Planning Use Among Women Attending a Health Care Facility in Rural Ghana”, Central African Journal of Public Health, 4(4), pp. 119-124.
  5. Demie, T., Demissew, T., Huluka, T., Workineh, F., Libanos, H (2018). ‘Postpartum Family Planning Utilization among Postpartum Women in Public Health Institutions of Debre Berhan Town, Ethiopia’, Journal of Women’s Health Care 7: 426.
  6. Mohammed-Durosinlorun, A., Idris, Z., Adze, J., Bature, S., Mohammed, C., Taingson, M., Abubakar, A., Avidime, S., Airede, L and Onwuafua, P. (2016). ‘A quantitative survey on potential barriers to the use of modern contraception among married women of high parity attending an antenatal clinic in Kaduna, Northern Nigeria’, Archives of Medicine and Surgery;1:30-4.
  7. Esike, C., Anozie, O., Ani, M., Ekwedigwe, K., Onyebuchi, A. and Ezeonu P. (2017). ‘Barriers to family planning acceptance in Abakaliki, Nigeria. Tropical Journal of Obstetrics and Gynaecology, 34:212-7.
  8. Eluwa, G., Atamewalen, R., Odogwu, K.,& Ahonsi, B. (2016). Success Providing Postpartum Intrauterine Devices in Private-Sector Health Care Facilities in Nigeria: Factors Associated with Uptake’, Global health, science and practice, 4(2), 276-283.
  9. Abdalla, A and Ahmmed, E (2017). ‘Evaluate Use and Barriers to Accessing
    IJMAES, Vol 6 (4), 836-853, December 2020 ISSN: 2455-0159
    International Journal of Medical and Exercise Science |2020; 6 (4) Page 852
    Family Planning Services among Reproductive Age Women in the White Nile, Rural Districts, Sudan’, Health Science Journal,11(6): 531.
  10. Durowade K., Omokanye, L., Elegbede, O., Adetokunbo, S., Olomofe, C., Ajiboye, A., Adeniyi, M., Sanni, T (2017). ‘Barriers to Contraceptive Uptake among Women of Reproductive Age in a Semi-Urban Community of Ekiti State, Southwest Nigeria’, Ethiopian Journal of Health Science, 27(1):121.
  11. Iliyasu Z., Galadanci, H., Danlami, K., Salihu, H and Aliyu, M (2018). ‘Correlates of Postpartum Sexual Activity and Contraceptive Use in Kano, Northern NigeriaAfrican Journal of Reproductive Health March; 22(1):103.
  12. Bwazi, C., Maluwa, A., Chimwaza, A. and Pindani, M. (2014). ‘Utilization of Postpartum Family Planning Services between Six and Twelve Months of Delivery at Ntchisi District Hospital, Malawi’, Health, 6, 1724-1737.
  13. Ochako, R., Mbondo, M., Aloo, S., Kaimenyi, S., Thompson, R., Temmerman, M and Kays, M (2015). ‘Barriers to modern contraceptive methods uptake among young women in Kenya: a qualitative study’, BMC Public Health, 15:118.
  14. Berta, M., Feleke, A., Abate, T., Worku, T., and Gebrecherkos, T. (2018). ‘Utilization and Associated Factors of Modern Contraceptives During Extended Postpartum Period among Women Who Gave Birth in the Last 12 Months in Gondar Town, Northwest Ethiopia’, Ethiopian Journal of health sciences, 28(2), 207–216.
  15. Tebeje B and Workneh D (2017). ‘Prevalence, Perceptions and Factors Contributing to Long-Acting Reversible Contraception Use among Family Planning Clients, Jimma Town, Oromiya Region, South-West Ethiopia. Journal of Women’s Health Care 6: 351.
  16. Kaydor, V., Adeoye, I., Olowolafe, T. and Adekunle, A. (2018). “Barriers to acceptance of post-partum family planning among women in Montserrado County, Liberia”, The Nigerian postgraduate medical Journal, 25(3), pp. 143-148.
  17. Jarvis, L., Wickstrom, J., Vance, G and Gausman, J (2018). ‘Quality and Cost Interventions during the Extended Perinatal Period to Increase Family Planning Use in Kinshasa, DRC: Results from an Initial Study, Global Health: Science and Practice, 6(3).
  18. Onifade, O., Ogungboye, O Adigun, J., Abikoye, A., Abiola O., Aliyu, S (2017). ‘Socio-Cultural Factors Influencing Choice of Bilateral Tubal Ligation Among Women Attending University of Ilorin Teaching Hospital’, KIU Journal of Social Sciences, ISSN: 1996902-3; 3(1): 37-46.
  19. Mohammed, A and Bhola, K (2019). ‘Challenges and prospects of contraceptives use among women attending family planning services in Yobe State, Nigeria’,World Scientific News, 122, 122-132.
  20. Ayanore, M., Pavlova, M., Groot, W. (2017). ‘Context-specific Factors and Contraceptive Use: A Mixed Method Study among Women, Men and Health Providers in a Rural Ghanaian District. African Journal of Reproductive Health, 21(2):81-95.
  21. Dona, A., Abera, M., Alemu, T., and Hawaria, D. (2018). ‘Timely initiation of postpartum contraceptive utilization and associated factors among women of child bearing age in Aroressa District, Southern Ethiopia: a community based cross-sectional study’, BMC public health, 18(1), 1100.
  22. Jalang’o, R., Thuita, F., Barasa, S. O., and Njoroge, P. (2017). ‘Determinants of contraceptive use among postpartum women in a county hospital in rural Kenya’, BMC Public health, 17(1), 604.
  23. Nigatu et al. (2016Nigatu, D., and Segni M (2016). ‘Barriers to Contraceptive Use Among Child Bearing Women in Ambo Town, West Shewa Zone, Oromia Regional State, Ethiopia’, Gynecology Obstetrics (Sunnyvale) 6: 352.
  24. Elsayda et al. 2018 Dr, Elsayda, H., Dr Mirfat, M and Dr Esraa, M (2018). ‘Factors Influencing Utilization of contraception among Women in Port Said City’, Journal of Nursing and Health Science (IOSR-JNHS); 7(5) PP 53-63.
  25. James et al. 2018James, S., Toombs, M., Brodribb. W (2018). ‘Barriers and enablers to postpartum contraception among Aboriginal Australian women: factors influencing contraceptive decisions’, Australian Journal of Primary Health, Research 24, 241–247.
  26. Unumeri, G., Ishakua, S., Ahonsi, B and Oginnia, A (2015). Contraceptive Use and Its Socio-economic Determinants among Women in North-East and North-West Regions of Nigeria: A Comparative Analysis’, African Population Studies, 29(2), 2015:1851.

Citation:

Ochala Ejura Jennifer, Rauf Ibrahim, Samsiah Mat, Syed Ali Gulab Jan (2020). Postpartum contraceptive practice and barriers to its use among mothers from a tertiary hospital in Abuja, Nigeria , ijmaes; 6 (4); 836-853.

A study to find out the prevalence and characteristics of low back ache among caregivers of adults with spinal cord injury

Gummadi Ashish

Senior Physical therapist, Department of Neuo-rehabilitation, Institute of Neurosciences, Kolkata,

Mail id: ashishgummadi@gmail.com

ABSTRACT

Back ground: Back pain is common among health workers especially patient’s caregivers in Spinal Cord Injury group. Objectives of the study were to estimate the prevalence of low back pain among the caregivers of adults with spinal cord injury. Care givers of all the spinal cord injured individuals who seeks for rehabilitation in the department of PMR were eligible to participate in the study.

Methodology: This was an observational study with a cross-sectional study design. After receiving the consent, the participants were asked to fill the questionnaire. First part of the questionnaire consists of demographical data of the patients and their caregivers. If the caregiver was reporting LBP, then they were asked to grade their pain intensity through Visual Analogue scale and also to fill Oswestry Disability Index (ODI) to identify the disability caused by the LBP. These data were used to find the prevalence of LBP among caregivers and also to find relationship with various demographical variables.

Results: One hundred patients and their caregivers’ data collected and analyzed. Out of these 20 where drop outs and samples female (42) caregivers reported that they have low back pain. In that 16 caregivers were males and 26 were females. There was no statistically significant difference between the patients and caregivers of the LBA group and no pain group in the demographic data except the duration of injury.

Conclusion: This study aimed to find out the prevalence and characteristics of low back ache of caregivers of the adult with low back pain. Study revealed 51.9% prevalence of low back pain among the SCI caregivers.

Key words: Low back pain, Caregiver, Spinal cord injury

Received on 11th September 2020, Revised on 12th October 2020, Accepted on 10th November 2020 DOI:10.36678/IJMAES.2020.V06I04.001

INTRODUCTION

Low back pain (LBP) is a common problem affecting most of the adults’ population at some point during their lifetime, especially in low and middle income countries 1, 2.  In a report of the World Health Organization (WHO) in 2003, it was found that about 80% of people have LBP at some time in their life 3. Quality of life, burden, satisfaction, and depression of caregivers have been extensively studied. Back pain is the most frequent cause of activity limitation in people below 45 years according to (NIH) guidelines4

Risk factors associated with LBP in the workplace have also been studied, particularly in occupations such as nursing, industrial work, police service, and fire service 5, 6. Lifting heavy objects, inappropriate lifting techniques and poor fitness levels are risk factors among nurses, whereas heavy physical activity, frequent bending and lifting, repetitive movements, being exposed to vibration, and depression are significant risk factors among industrial workers 7-10.

After the Traumatic or Non- Traumatic injury the individual becomes spinal cord injury there is of the need for assistance in their daily living activities. This might be assistance in feeding, bathing dressing shifting to uneven surfaces or even surfaces toileting or dressing. Today with the change in health care, we see more family members as the source of care support more than 40% of spinal cord injured individuals use some assistance or the other with their family members females are more likely to have a paid attendant as caregiver, while male have their parent assist.

Manual patients transfer tasks between bed wheel chair and bath cart, perceived physical exertion were consistently associated with different measure of LBP. The symptoms of low back pain are notice with flexion of the back, and when lifting the heavy objects. Patients handling was found to be an extremely hazardous job that had substantial risk of causing a low back injury whether with one or two patient handlers. Prevalence of LBP was significantly higher among caregivers (58%) compared with age- and BMI-matched controls (27.6%). The prevalence of LBP was also higher among caregivers of SCI patients with long duration of injury; i.e. LBP was associated with care-giving duration11.

Objectives of the study: Objectives of the study were to know the prevalence of low back pain among the caregivers of adults with spinal cord injury and to find the disability caused by low back pain in caregivers of adults with spinal cord injury.

METHODOLOGY

Care givers of all the spinal cord injured individuals who seeks for rehabilitation in the     department of PMR are eligible to participate in the study. After receiving the consent, the participants were asked to fill the questionnaire. First part of the questionnaire consists of demographical data of the patients and caregivers. If the caregiver is reporting LBP, then they will be asked to grade their pain intensity through Visual Analogue scale and also to fill Oswestry Disability Index (ODI) to identify the disability caused by the LBP.

This study design  was observational study and the study setting done at Urban and rural population around the outskirts of Bangalore. 100 subjects were taken for the study and Simple Random Sampling method used to allocate the subjects in different group. Subjects aged between 25 to 50 years of both sexes from urban and rural areas of Bangalore. The study conducted for duration of 10 months.

Selection criteria

Inclusion Criteria: age- 25-50yrs, both male and female subjects, Subjects with spinal cord injury, subjects with six months post injury, subjects attending for more than 4 hours.

Exclusion Criteria: Previous history of back pain irrelevant to care –giving, Caregivers who have history of back surgery, Caregivers who have a history of back fracture, Caregivers with physical disability

Outcome Measure: Demographic variables, Pain, Neck Function

Measurement Tools: Demographic Questionnaire, Oswestry Disability Index–short form (ODI) and  VAS scales.

Procedure for Intervention: As the questionnaire is being filled and returned by the subjects, the data were analyzed to find outcome and significant differences in assessment of risk of low back pain in caregivers with spinal cord injury patients.

Figure 1. Assessment of ODI Scale with Patient

Figure 2. Transferring Techniques for Caregivers

RESULT

Table 1:Demographicdataofgenders
Table 2: Duration of care in relation to gender
Table 3: Average time spend with patient according to gender
Table 4: Duration of care and average time spend on patient with neck and back pain
Table 5: Duration of care and average time spend with patient in relation to VAS and ODI
Graph: 1 Graphical representation of duration of care and average time spend with patient in relation to VAS and ODI

One hundred patients and their caregivers’ data collected and analyzed. Out of these 20 where drop outs and samples female (42) caregivers reported that they have low back pain. In that 16 caregivers were males and 26 were females. There was no statistically significant difference between the patients and caregivers of the LBA group and no pain group in the demographic data except the duration of injury.

DISCUSSION

In the present study, prevalence of LBA was found to be 51.9%. Our results are similar to the study reported by Barak et al among Turkies people and they reported 54%.

The prevalence was also higher among the caregivers of SCI patients with long duration injury; i.e. LBA was associated with care giving duration. This was attributed to activities that cause LBA having carried out for long time. ASIA impairment scale was used to evaluate the patient’s level of injury and the assistance of caregivers required in their mobility LBA 12.

SCIM scores were not associated with caregivers’ LBA.  As there are no mechanical devices available in India to transfer a patient, manual handling is common. The availability of man power in a home set up also an issue. A high frequency of LBA among caregivers with low ASIA score was thus an expected result. The use of mechanical patient lift systems is advantageous in reducing the load on the back and healthcare workers are recommended to use these systems 13, 14.

They also found that LBP was more common among caregivers of patients with motor complete lesion identified according to the American spinal injury impairment scale (AIS). transfer and locomotion of the patients nursed by caregivers with LBP were significantly lower than those of patients nursed by caregivers without LBP15 .

LBP causes a large financial burden on individuals, families, communities, industry and governments including the costs of medical care, compensation payment, productivity loss, employee retraining, administrative expenses and litigation 16.

Low back pain (LBP) is well recognized to be an enormous general health problem and is the leading cause of activity limitation throughout much of the world. LBP is a major problem all over the world, especially in low and middle income countries 17.

Ethical clearance:

Ethical Clearance: Ethical clearance has obtained from Hosmat College of Physiotherapy and Research Institute, Bangalore to conduct this study with reference number: 33/PHSIO/IRB/2018-19dated 07/06/2018.

Conflicts of Interest

The author declares that there is no competing interest in publishing this article.

Fund for the study: This is self-funded study.

CONCLUSION                                                                               

This study aimed to find out the prevalence and characteristics of low back ache of caregivers of the adult with low back pain. Study revealed 51.9% prevalence of low back pain among the SCI caregivers. Duration of injury was the key factor for the occurrence of low back pain. 

REFERENCES

  1. Dunn KM, Croft PR. (2004). Epidemiology and natural history of low back pain. Eura Medicophys., 40(1): 9-13.
  2. Tong HC, Haig AJ, Nelson VS, Yamakawa KS, Kandala G, Shin KY. (2003). Low back pain in adult female caregivers of children with physical disabilities. Arch Pediatr Adolesc.; 157:1128-1133.
  3. Feng CK, Chen ML, Mao I F. (2007). Prevalence of and risk factors for different measures of low back pain among female nursing aides in Taiwanese nursing homes. BMC Musculo skelet Disord; 8: 52.            
  4. Bardak a, Erhan and Gündüz (2012). Low back pain among caregivers of spinal cord injured patients j rehabil med.; 44: 858-861.
  5. Ebru Yilmaz Yalcinkaya, et al. (2007). A Pilot Study Low Back Pain Prevalence and Characteristics in Caregivers of Stroke Patients, 17(5): 389-393.
  6. Tong HC, HaigAJ, NelsonVS, YamakawaKS, KandalaG, ShinKY (2003). Low back pain in adults’ female caregivers of children with physical disabilities. Arcives of pediatric and Adolescence Medicine; 157(11):1128-33.
  7. TomoikaK, KumagaiS, HiguchiY, TsujimuraH, AraiY, Yoshida J. (2007). Low back load and satisfaction rating of caregivers and care receivers in bathing assistance given in nursing home for the elderly practicing individual care) Sangyo Eiseigaku Zasshi;  49(2); 54-58.
  8. Majim Y, HorikikawaJ, ShonoI, (2004). Study on the Lower back pain in home helper’s and. Development of materials for occupational health education). 1; 26(1); 59-74.
  9. Brown AR, Mulley G P (1997). Injuries sustained by caregivers of disabled elderly people. Age Ageing; 26(1); 21-23.
  10. MarrasWS, Davis KG, Kriking BC, Bertsche PK. (1999). A Comprehensive analysis of low back disorders risk and spinal loading during the transferring and repositioning of patients using different techniques, Ergonomicsn ; 42(7);904-926.
  11. TomoikaK, KumagaiS, HiguchiY, TsujimuraH, AraiY, Yoshida J. (2007).Low back load and satisfaction rating of caregivers and care receivers in bathing assistance given in nursing home for the elderly practicing individual care.)Sangyo Eiseigaku Zasshi , 49(2); 54-58.
  12. SchibyeB, Hansen AF, Hye-Knudsen CT, (2003). Biomechanical analysis of the effect    of  changing patient-handling technique. Appl Ergon; 34(2):115-123.
  13. FrangalaG, FragalaM, Pontani-Baily L. Proper positioning of clients: a risk for caregivers.) AAOHN J .2005Octuber; 53(10); 438-442.
  14.  Davidson M & Keating J (2001). A comparison of five low back disability      questionnaires: reliability and responsiveness. Physical Therapy; 82:8-24.
  15. Joshua Israel Vincent, Joy Christine Mac Dermid Ruby Grewa, Vincent     Prabhakaran Sekarand Dinesh Balachandran, (2014). Translation of Oswestry Disability Index into Tamil with Cross Cultural Adaptation and Evaluation of Reliability and Validity, Orthopaedics Journal, 8, 11-19.
  16. Matthew O.B. Olaogun, Rufus A. Adedoyin, Innocent C. Ikem & Olubusayo R. Anifaloba  Physiotherapy Theory and Practice, Volume 20, 2004-Issue 2; 10 Jul 2009.
  17. Craig CL, Marshall AL, et al. (2003). International physical activity questionnaire: 12-Country reliability and validity. Medicine and Science in Sports and Exercise, 35(8):1381-395. 

Citation:

Gummadi Ashish (2020). A study to find out the prevalence and characteristics of low back ache among caregivers of adults with spinal cord injury, ijmaes; 6 (4); 829-835.

Rehabilitation of a patient with multiple fractures caused by tractor running over half of the body: A case report

Heera vijayakumar1, Diker Dev Joshi2

Author:

2Lecturer, Padmashree Institute of Physiotherapy, Bangalore, Karnataka, India

Corresponding Author:1Professor, Padmashree Institute of Physiotherapy, Bangalore, Karnataka, India, Mail id: heerapt1977@gmail.com

ABSTRACT

Introduction: A case of 48 year old female patient with multiple fractures atright shoulder, chest and Pelvis was admitted in BGS Global hospital Kengeri, Bangalore. The patient met with an accident in which a tractor passed though half of her body leading to multiple fractures. As most of the fractures were turned out to be stable the patient was given painkillers and calcium tablets and started physiotherapy after 1 week.
Methodology: Physiotherapy was started with Ankle Toe Movements, ROM exercise, sponge ball exercise, Incentive spirometry, Trunk rotation exercises, and gentle massage on the injured areas. The patient was given gait training in later stage followed by exercises in walker. Pre and post assessment taken for muscle power of shoulder and hip, Visual Analogue Scale for body pain and Functional Independent Measures to find the outcome.
Result: After 8 weeks of daily physiotherapy, the patient improved with muscle power, reduced body pain, improved body function and the patient started walking without any assistive devices.
Conclusion: With immediate physiotherapy even with multiple fractures the patients can get back to their Activities of Daily Living.
Keywords: Fracture Rehabilitation, Muscle Power,  Visual Analogue Scale, Functional Independent Measures, Activities of Daily Living,
Received on 15th August 2020, Revised on 28th August  2020, Accepted on 31st  August 2020, DOI:10.36678/IJMAES.2020.V06I03.006

INTRODUCTION  

A 48 year old female patient named Niveditha who was housewife by profession presented with pain on pubis and upper back region along with right shoulder and right area of chest. History of present illness showed that on 6th December 2018, patient went to pond to immerse a god idol after a prayer when a tractor passed through half of her body. She was immediately shifted to BGS global hospital Kengeri, Bangalore, where X ray was taken and it was found that she had multiple fractures of ribs, pelvis, neck of femur and both pubic rami. Along with that she had also sustained injury on the spine of scapula. But all the fractures were found to be stable. Her shoulder was immobilized in a sling for a week whereas, for remaining fractures painkillers and calcium tablets were advised by Orthopedician1. She was then started on physiotherapy protocol.

METHODOLOGY

Before the physiotherapy treatment pre values were taken for Pain using VAS scale, MMT for muscle power of shoulder and hip and functional Independence through Functional Independence measure 2,3,4.  Physiotherapy was started with ankle toe movements5, limited Range of Motion exercises for right upper and lower limbs and full ROM exercises for left upper and lower limbs6. Patient was advised for bed rest to prevent pressure sores and she was kept in air Bed7. For the fingers, patient was given a sponge ball and was advised to squeeze it at least 3 times a day (1 set of 10 repetitions each time) 8. As patient was depressed she was given psychological counselling9. The patient had mild pleural effusion for which she was given incentive spirometry (1 set of 10 repetitions each time) twice a day10.

On 3rd week the repeat X ray was taken on which it was seen that fractures were not healed completely. The shoulder sling was removed and trunk rotation exercises were started carefully with 15 degrees of spinal rotation11.  

On 4th week, patient’s preparation for sitting was started. Initially patient was bought to inclined position by placing 2 pillows over her entire back to avoid the postural hypotension, which could have occurred had the patient been brought to 90° supine lying directly. The numbers of pillows were weekly increased to increase the inclination. By 8th week patient was made to sit 90°.After that the patient was slowly brought to long sitting12.

Once long sitting was achieved, high sitting training was started13. Then sitting to standing practice was started for the patient with the support from the physiotherapist14.Once the patient was comfortable in standing position she was made to stand for more time with the help of walker and it was followed by walking few steps with the help of walker15.Slowly the patient could walk herself with the help of walker.

On 8th week, a repeat X ray was done which showed healed fractures. The patient was then taught weight lifting and weight bearing exercises16. The patient started walking without any walking aids. At this stage the post outcome measures scores were taken [Table 1] which showed good improvement. Patient was already off the medications except calcium tablets and she was not taking even painkillers. The patient was than taught home exercises and regular physiotherapy was stopped.

Table 1: Pre and Post Values of Outcome Measures

Ethical Clearance: Ethical clearance has obtained from BGS Global hospital Kengeri, Bangalore to conduct this study.

Conflict of interest: There was no conflict of interest to conduct this study.

Fund for the study: It was aself financed study.

CONCLUSION

Early physiotherapy intervention is quite helpful for improving the functional independence of patient even in multiple fracture case. ROM exercises, Bed Mobility, Trunk rotation exercises, functional reeducation along with psychological counselling can help  a great deal to make the patient independent.

REFERENCES

  1. Wraighte PJ, Scammell BE. (2006 Jun). Principles of fracture healing. Surgery (Oxford). 1; 24(6):198-207.
  2. Bergh I, Sjöström B, Odén A, Steen B. (2001 Oct 1). Assessing pain and pain relief in geriatric patients with non-pathological fractures with different rating scales. Aging Clinical and Experimental Research, 13(5):355-61.
  3. Aitken DM, Bohannon R W. (2001 Mar 1). Functional independence measure versus short form-36: relative responsiveness and validity. International Journal of Rehabilitation Research, 24(1): 65-8.
  4. Gajdosik RL, Bohannon RW. Clinical measurement of range of motion: review of goniometry emphasizing reliability and validity. Physical therapy. 1987 Dec 1; 67(12):1867-72.
  5. Hickey BA, Cleves A, Alikhan R, Pugh N, Nokes L, Perera A. (2017 Sep 1). The effect of active toe movement (AToM) on calf pump function and deep vein thrombosis in patients with acute foot and ankle trauma treated with cast–A prospective randomized study. Foot and Ankle Surgery, 23(3):183-8.
  6. Kisner CA, Colby LA. (2012). Range of motion Therapeutic exercise foundations and Techniques, 61-73.
  7. Biggie J, et al. (1999 Jul). Air distribution device for the prevention and the treatment of decubitus ulcers and pressure sores. United States patent US, 5; 926; 884.
  8. Magnus CR, et al. (2013 Jul 1). Cross-education for improving strength and mobility after distal radius fractures: a randomized controlled trial. Archives of physical medicine and rehabilitation, 94(7); 1247-55.
  9. Cuijpers P, van Straten A, van Schaik A, Andersson G. (2009 Feb 1). Psychological treatment of depression in primary care: a meta-analysis. British journal of general practice., 59 (559); e51-60.
  10. Overend TJ, et al. (2001 Sep 1). The effect of incentive spirometry on postoperative pulmonary complications: a systematic review. Chest; 120(3):971-8.
  11. Yamauchi T.(2015 Jun 1). The effect of trunk rotation during shoulder exercises on the activity of the scapular muscle and scapular kinematics. Journal of Shoulder and Elbow Surgery; 24(6):955-64.
  12. Ladozhskaya-gapeenko EE, et al. (2018 Jul 3). Method for treating and preventing diseases having neurological, cardiological and therapeutic profiles. United States patent US, 10; 10; 469.
  13. Arry RH. (2004 Nov). The interactional management of patients’ physical incompetence: a conversation analytic study of physiotherapy interactions. Sociology of Health & Illness. 26(7):976-1007.
  14. Hoppenfeld S, Murthy VL, editors. Treatment and rehabilitation of fractures. Lippincott Williams & Wilkins; 2000.
  15. Härdi I, Bridenbaugh SA, Gschwind YJ, Kressig RW. (2014 Apr 1). The effect of three different types of walking aids on spatio-temporal gait parameters in community-dwelling older adults. Aging clinical and experimental research, 26(2); 221-8.
  16. Yung P, Lai YM, Tung PY, Tsui HT, Wong CK, Hung VW, Qin L. (2005 Aug 1).  Effects of weight bearing and non-weight bearing exercises on bone properties using calcaneal quantitative ultrasound. British journal of sports medicine, 39(8):547-51.
Citation: Heera vijayakumar, Diker Dev Joshi (2020).Rehabilitation of a patient with multiple fractures caused by tractor running over half of body: A case Report, ijmaes; 6 (3); 825-828.

Plyometric versus high intensity aerobic exercise among over weight college students

Jibi Paul1, T.Bhuvaneswari2

Author:

2B.P.T. Graduate, Faculty of Physiotherapy, Dr.MGR. Educational and Research Institute, Deemed to be University, Chennai, Tamilnadu, India

Corresponding Author:

1Pofessor, Faculty of Physiotherapy, Dr.MGR. Educational and Research Institute, Deemed to be University, Chennai, Tamilnadu, India Mail id: physiojibi@gmail.com

ABSTRACT

Background of the study: Overweight is more body fat than optimally healthy individuals, overweight is common where food supplies are plentiful and life style is sedentary. Plyometric is designed to enhance muscular power and explosiveness. The word aerobic meaning exercise with oxygen, high intensity aerobic exercise can help on control weight and reduce stress. Objective of the study was to find the effect of plyometric exercise and high intensity aerobic exercise and also to compare the effect between the exercises among overweight college students.
Methodology: This was a comparative study with quasi experimental design. The subjects were divided into two equal groups, 15 samples in Group A and Group B by convenient sample method. Group A received high intensity aerobics like jogging, burpees, mountain climber exercise, squat with side step, wall push ups, where Group B received plyometric exercises like squat jack, skater jump, jumping side lunge, rock star jump and high knees. Both exercises were given for three sessions in a week. Inclusion criteria include BMI of 25-30 and above, both male and female college students of aged 18-23 years. The measurement tool used was Body Mass Index and Waist Circumference.
Result: The result showed a decrease in BMI and waist circumference in both the groups. But the weight reduction was more in Group A when compared to the Group B with p >0.000.
Conclusion: The study concluded that high intensity aerobic exercise decreases the BMI and waist circumference effectively among overweight college students when compared to the plyometric exercises.
Keywords: Plyometric, High intensity aerobic exercise, Waist circumference, Body Mass Index
Received on 15th August 2020, Revised on 27th August  2020, Accepted on 31st  August 2020, DOI:10.36678/IJMAES.2020.V06I03.005

INTRODUCTION  

Overweight is having more body fat than is optimally healthy individuals. The definition of overweight in adults has variations over time. Obesity and overweight constitute an important public health problem because of associated increase risk of hypertension, coronary heart disease, type 2 diabetes, stroke, gall bladder disease, certain type of cancer, osteoarthritis, sleep apnoea and other disorders. Overweight range is calculated according to the body mass index (BMI), where BMI >25 1, 2.

High intensity aerobics will help to control weight and reduce stress by conditioning the heart and lungs with the help of oxygen (4). High intensity aerobics will help to relax the tensed muscles and regular practice of aerobics will increase the production of endorphins (a natural sedative) and catecholamine (chemical substance which stabilize the mood). So, long term aerobic exercise is considered to be reasonable and effective to reduce weight. Some scholars suggest that high intensive exercise of 85% VO2 max with appropriate positive rest in short time is more effective to lose weight 3, 4, 5.

Plyometric is a type of training were muscles undergo a rapid elongation followed by immediate shortening (stretch-shortening contraction) utilizing the elastic energy stored during stretching phase 7. Plyometric training is a fantastic cardio work out and a great way to burn the calories. So, it is an effective work out supplement to lose weight. In fact muscle stronger and improve endurance capabilities. It enhances the metabolism and helps to burn calories. Indeed, this exercise will facilitate weight loss 6, 7.

Both high intensity aerobics and plyometric are meant for burning calories by increasing metabolism. So, it is considered as an important component to reduce overweight. Body mass index (BMI) is a simple and widely used method for estimating body fat mass. Belgian statistician developed BMI in 19th century (4). BMI is not only used classify obesity and overweight but also to find out life expectancy and prevalence of overweight and obesity related issues and co morbidities 8,9,10

METHODOLOGY

This was a comparative study with quasi experimental design. The subjects were divided into two equal groups, 15 samples in Group A and Group B by convenient sample method. All samples were selected for the study from the ACS medical college and hospital, Chennai. Group A received high intensity aerobics like jogging, burpees, mountain climber exercise, squat with side step, wall push ups, where Group B received plyometric exercises like squat jack, skater jump, jumping side lunge, rock star jump and high knees. Both exercises were given for three sessions in a week. Inclusion criteria include BMI of 25-30 and above, both male and female college students of aged 18-23 years. The measurement tool used was Body Mass Index and Waist Circumference. The study was conducted for duration of 3 months. Subjects with hypertension, any cardio vascular disease, any depressions, chronic renal failure, smoking status, history of diabetes, any history of recent fracture were excluded from the study. 

Procedure: According to the BMI reading of over (26-30) is considered as overweight and the BMI was calculated from the following equation BMI(in kg m2)=Body mass(in kg)/Height 2 (in m).Thirty college students were selected from the ACS medical college and hospital, in the age group of 18-23 years selected conveniently .The selected 30 subjects were provided with the informed consent after obtaining proper consent the selected  and subjects were divided into two equal groups of fifteen each namely high intensity aerobic exercise was given to group A(15 subjects) and plyometric exercise was given to group B(15 subjects).Overweight was tested before(pre) and  after(post) the training program for both experimental  groups by using Waist circumference and conventional method was used to measure BMI, weight, height of each subjects was measured using a wall stadiometer, WHR, body fat percentage%(4).The obtained values were recorded. According to the protocol, the exercises had been given for Group A (High Intensity Aerobic Exercise) and Group B (Plyometric Exercise) followed by three months, the BMI and Waist circumference was again measured and the obtained values are recorded.

Exercise Intervention

The selected subjects had undergone plyometric and high intensity aerobics thrice a week which have been in practice. Before the training they had undergone warm up for 5 minutes and cool down for 5 minutes. The group A has been engaged with High intensity aerobics of Jogging, Burpees, Mountain climbers, Squat with side sitting, Wall push up, the group B has been engaged with an Squat jack, Skater jump, Jumping side lunge, Rock star jump, High knees. Each exercise consists of 5 reputations in high interval of 30 seconds practice and low interval of 10 seconds of resting period.

Group A (High Intensity Aerobic Exercises)

Jogging: Jogging is running at a gentle pace. It is as running slower than 6 miles per hour (10 km/h).Jogging will have a wider lateral spacing of foot strikes, creating side- to-side movement that likely adds stability at slower speeds or when coordination is lacking.

Fig.1 Jogging

Burpees: Burpees or squat thrust is a full body exercise used in strength training. The basic movement is performed in four steps and known as a” four-count burpees.”

Method: Begin in a standing position. Move into a squat position with your hands on the ground (count-1). Kick your feedback into a plank position, while keeping your arms extended (count 2). Immediately return your feet into squat position (count 3). Stand up from the squat position (count 4).

Fig. 2 (a, b, c, d) Burpees

Mountain Climber Exercise: Mountain climbers are a great total body exercise in which you are going to utilize your entire core because it is started in plank position.

 The shoulders should stabilize your upper body. The triceps muscle should work isometrically to keep you in place.

Fig.3 (a, b). Mountain Climbers
Fig.4 (A, B) Squat with Side Step

Squat With Side Step: Side step and squat. Stand with your feet together. With your right foot take a wide step out to the right and squat down. As you straighten the legs, step your right foot back in. repeat on the left side.

Wall Push Ups: Face the wall, standing a little farther than arm’s length away, feet- shoulder width apart. Lean your body forward and put your palms flat against the wall at shoulder height and shoulder width apart.

Fig.5 Wall Push Ups

Group B  (Plyometric Exercises)

Squat Jack: Squat is a compound, full body exercise that trains primarily the muscles of the thigh, hips and buttocks, quadriceps femoris muscle( vastus lateralis, vastus medialis, vastus intermedius and rectus femoris),hamstrings as well as strengthening the bones, ligaments and insertion of the tendons throughout the lower body.

Skater Jump: It is landing in one foot without touching the other one down and at the same time you can touch the ground with each jump so to make this a little bit easier you can touch your foot down on each sides alternatively.

Fig.6 (a, b) Squat Jack
Fig.7 Skater Jump and Fig.8 Rock Star Jump

Jumping Side Lunge: Stand on your left leg with your hips and knees slightly bent extend your left hip, knees and ankle to jump forward and to the right at a 45-degree angle land on the ball of your right foot with your hips and knees slightly bent to absorb the impact immediately jump off your right leg in the opposite direction.

Fig.9 (a, b) Jumping Side Lunge

Rock Star Jump: Also called as side-straddle hop in the US military, is a physical jumping exercise performed by jumping to a position with the legs spread wide and the hands touching overhead, sometimes in a clap, and then returning to a position with the feet together and the arm at the sides.

High Knees: Skip in place by hopping on your right leg while bringing the left knee up towards your chest. Engage your abs as the knee comes towards your chest. Switch legs, and keep skipping while pumping your arms. This completes one reputation.   

Fig.10 (a, b) High Knees

Data analysis and interpretation

Table-1 comparison of BMI between Group- A and Group- B in Pre and post test

The above table reveals the mean, standard deviation(S.D),T- test, degree of freedom (DF) and P values of the BMI between (Group A) and (Group B) in pre-test and post- test.

This table shows that there is no significant difference in the pre-test values of the BMI between Group A and Group B (*P>0.05). This table shows that statistically significant difference in the post test values of the BMI between group A and group B (**-P≤0.01).

Graph – 1.Comparison of BMI between Group A and Group B in pre and post test.
Table- 2: Comparison of waist circumference between group-a and group – b in pre and post test

The above table reveals the mean ,standard  deviation (S.D),T-test, degree of freedom(DF) and P-values of the waist circumference between (group A) and (group B) in pre-test and post-test.

This table shows that there is no significant difference in pre-test values of the waist circumference between group A and group B (*P>0.05). This table shows that statistically significant difference in post-test values of the waist circumference group A and group B (**-P≤0.01)

Graph-2: Comparison of Waist Circumference between Group A and Group B in the pre and post test.
Table 3: Comparison of BMI within Group A & Group B between Pre & Post Test Values 

The above table reveals the mean, standard deviation (SD),t-values and P-values of the BMI between pre-test and post-test within group A and  group B.

In BMI there is a statistically highly significant difference in the pre-test and posttest values within group A and group B. (**-P≤0.01)

Graph-3: Comparison of BMI within Group-A and Group-B between pre and post test values
Table 4: Comparison of waist circumference within Group-A & Group-B between pre & post test values

The above table reveals the mean, standard deviation (SD), t-value and p-value of the waist circumference between pre-test and post-test within group A and group B.

In waist circumference there is a statistically significant difference between the pre-test and post-test values within group A and group B (*-P≤0.01).

Graph 4: Comparison of Waist Circumference within Group A and Group B between Pre and Post- Test Values

RESULT

Pre and Post-test values within Group A and B, it shows a statistically significant difference in the BMI where P value is 0.000*. And also in pre and post-test values within Group A and B, it reveals significant difference on Waist Circumference where P value is 0.000*.

On comparing between the Group A and B found significant difference of P value 0.000*.  BMI found significant mean difference of 2.75 (27.24-24.49) and 0.78 (27.40-26.62) respectively.   Waist Circumference also found significant difference with mean difference of 29.74 (95.40-65.66), 16.54 (100.80-84.26) respectively. 

DISCUSSION

Based on the selection criteria 30 subjects with overweight of 25 to 30 were participated in the study. The purpose of this study was to compare the effect of plyometric versus high intensity aerobics among overweight college students.

Aerobic exercise has significant improvement on waist circumference than plyometric exercises. Outcome measures used for this study were Body Mass Index and waist circumference 11.

Plyometric burns the maximum amount of calories in the shortest amount of time while toning the body from head to toe, reported the importance of Plyometric exercise in fitness. Plyometric exercises to a High intensity interval training program may be more beneficial than only High intensity interval training in obese female adolescents 12, 13.

Training at high intensity is superior to improve cardiopulmonary fitness and to reduce % body fat in adults with obesity compared to traditional exercises. Another issue is the motivation for an exercise program in person with overweight depression; a negative body image and embarrassment are factors that can influence the decision to participate in an exercise program. Recent evidence suggests that HIIT can be a time-efficient strategy to promote health in sedentary overweight /obesity individuals 14.

In this review and Meta analysis, the effectiveness of high intensity training in terms of weight reduction was compared to plyometric forms of exercise in overweight college students. Based on the results on this Meta analysis we can conclude that training at high intensity aerobic is a better method to reduce overweight than plyometric15.

In this study the values of BMI and waist circumference in centimetres of pre-test and post-test were compared by the mean difference. When the inter group mean values of BMI were analysed, in Group A mean for BMI pre-test and post test was BMI 27.24 and 24.49 respectively. The mean values of Group B for pre test and post test was 27.40 and 26.62 respectively from the data analysis. The result shows that the reduction in body weight is more in Group A (High intensity aerobic exercise) compare to Group B (plyometric exercise).

When the inter group mean values of waist circumstance was analysed, Group A pre test mean waist circumstance 96.40 and post test mean waist circumstance 65.66 .The mean values of group B pre test mean waist circumstance 100.80 and post test mean 84.26 from the data analysis it shows that there was reduction in the waist circumstance in group A (High intensity aerobic exercise).

Ethical Clearance: Ethical clearance has obtained from Faculty of Physiotherapy, DR.MGR. Educational and Research Institute, Chennai to conduct this study with reference number: A033/ PHSIO/IRB/2017-18dated 07/01/2018.

Conflict of interest: There was no conflict of interest to conduct this study.

Fund for the study: It was aself financed study.

CONCLUSION

This study concludes that the high intensity aerobics has considerable effect in reducing the weight among overweight college students. Therefore the HIAE is considered to be more effective than plyometric exercise program.

High Intensity Aerobic Exercise can effectuate weight reduction in a shorter period of time, but also mechanisms like increased post exercise fat oxidation and a decreased post exercise appetite could play a role.

Training at high intensity is superior to improper cardio pulmonary fitness and to reduce body fat percentage in adults with overweight compared to plyometric exercise.

REFERENCES

  1. Young-Han Park, PhD and Jung-Ho lee, PhD: (2017).The effects of abdominal interferential current therapy on waist circumference and visceral fat distance in obese women., J.Phys Ther.Sci ; 29; 1680-1683.
  2. A Febin jebaraj, Dr C Robert Alexander (2016). Effect of plyometric and aerobic exercise on obesity among school students. International journal of physical education, sports and health,  3 (2); 83-85.
  3. Liye zheng (2016). Influence of aerobic it intensive training on obese college students. Biomedical research, 279 (2); 392-395.
  4. Derrick cetin (2016). Comprehensive evaluation for obesity: Beyond Body mass index., J Am Osteopath Assoc., 116(6); 376-382.
  5. Racil, Ghazi Etal (2015). Plyometric exercise combined with high intensity interval training improves metabolic abnormalities in young obese female more so than interval training alone. Canadian science publishing apnm -0384, R2.
  6. Alberto Carvalho, Paulo Maurao and Eduardo Abade (2014). Effect of strength training combined with specific plyometric exercise on body composition, vertical jump height and lower limb strength development in elite male hand ball players: a case study, Journal of human kinetics volume. 41; 125-132.
  7. Su Reid- St. John (2015). Blast fat with plyometric. Make your body a jiggle –free zone with these fun fat blasting moves. (4); 4422-4438.
  8. KwonHR. Kim HR (2014). Effect of aerobics exercise on abdominal fat, thigh muscle mass and muscle strength, Korean diabetes, 34; 23-31.
  9. Sousa NMendes R., et al (2013). Long –term effects of aerobic training versus combined aerobic and resistance training in modifying cardiovascular disease risk factors in healthy elderly men., Geriatr Gerontol Int; 13; 928-935. 
  10. Coquart J.B., lemaire, et al (2010). Intermittent versus continuous exercise: effects of perceptually lower exercise in obese women. Med.Sci.Sports.Exercise.40 (8);1546-1553.
  11. Raquel patricia ataide lime et al (2015). BMI, overweight status and Obesity adjusted by various factors in all age groups in the population of a city in northern Brazil. P: 914-271. 4141/ F: 914- 827- 5308.
  12. Harris (2009). Effect of school based physical activity interventions on body mass index in children, a meta-analysis, 31,180(7); 719-26.
  13. Baker LB, Lang JA, Kanney WL (2009). Change in body mass accurately and reliably predicts change in body water after endurance exercise. Eur J Appl Physiol; 105; 959-967.
  14. Gan SK, Thompson W (2003). Changes in aerobic capacity and visceral fat. Diabetes care, 26; 1706-13.
  15. Owens S, Gutin Allison Riggs Ferguson M, et al (1999). Effect of aerobic training on total and visceral fat in obese children’s., Medicine and science in sports and exercise, 31(1); 143-148.
Citation: Jibi Paul, T.Bhuvaneswari (2020).Plyometric versus high intensity aerobic exercise among over weight college students, ijmaes; 6 (3); 811-824.

Effects of balance training and strengthening exercises on individuals with idiopathic Parkinson’s disease

Purnima Singh1, Panomootil Blessy Varghese2

Author:

2 Student M.P.T Neurology, Hosmat College of Physiotherapy, RGUHS University, Bangalore, Karnataka, India

Corresponding Author:

1Principal of Hosmat college of Physiotherapy, RGUHS U niversity, Bangalore, Karnataka, India Mail id:  purnimasingh29@gmail.com

ABSTRACT

Introduction: Parkinson’s disease is a major concern when the disease progresses to the middle stage of the illness. The typical features of Idiopathic Parkinson’s disease (IPD) are tremors impairment of the muscle tone, involuntary movement and bradykinesia. Improvement in strength and balance of IPD patients has improved their mobility functions. Especially, balancing exercises on uneven surfaces with eyes open and closed help them in gaining confidence to move outdoor independently with lesser risk of fall.
Methodology: A total numbers of 30 subjects were considered for the study. All participants underwent two sets of measurement. Pre-test which was done at the beginning of the study & the post-test which was done at the end of 3 & 6 months of the study. 30 patients effectively completed the set of balancing and strengthening exercises with eyes closed & open for the period of 6 months.  
Results: All the subjects showed significant changes in BBS & ABC scales after 6 months of strength and balance training programs. The mean value of the pre- test scores were BBS – 37.23 ± 10.7 ABC – 57 ± 13.62 and post – test scores were BBS – 44.30 ± 8.78 ABC – 71.17 ± 13.62.
Conclusion:  From the statistical analysis it is evident that strengthening and balancing training program on uneven surfaces are effective in reducing the risk of fall and increasing the confidence of mobility in patients with PD.
keywords:  Parkinson’s disease; strengthening exercises; Therabands; balancing exercises.
Received on 15th August 2020, Revised on 27th August  2020, Accepted on 31st  August 2020, DOI:10.36678/IJMAES.2020.V06I03.004

INTRODUCTION  

Idiopathic Parkinson’s disease [IPD] is a group of the conditions affecting the motor system hence also called as motor system disorder. This is resulted due to the loss of dopamine producing in the brain cells.

Characteristics of Parkinson’s disease are progressive loss of muscle control, which leads to trembling of the limbs and head while at rest, stiffness, slowness, and impaired balance. As symptoms worsen, it may become difficult to walk, talk, and complete simple tasks1.

Most of the movement-related symptoms of IPD is considered as the second most common neurodegenerative disorders.2 When the amount of dopamine is too low, communication between the substantia nigra and corpus striatum becomes ineffective, and movement becomes impaired; the greater the loss of dopamine, the worse the movement-related symptoms. Other cells in the brain also degenerate to some degree and may contribute to non-movement related symptoms of Parkinson’s disease.3

The cause of Parkinson’s disease is unknown but researchers speculate that both genetic and environmental factors are involved; some genes have been linked to the disease. Although it is well known that lack of dopamine causes the motor symptoms of Parkinson’s disease, it is not clear why the Dopamine-producing brain cells deteriorate.

Genetic and pathological studies have revealed that various dysfunctional cellular processes, inflammation, and stress can all contribute to cell damage. In addition, abnormal clumps called Lewy bodies, which contain the protein alpha-synuclein, are found in many brain cells of individuals with Parkinson’s disease. The function of these clumps in regards to Parkinson’s disease is not understood. In general, scientists suspect that Dopamine loss is due to a combination of genetic and environmental factors2, 3.

Early symptoms of PD are subtle and occur gradually.  In some people the disease progresses more quickly than in others. 

The primary symptoms of Parkinson’s disease are all related to voluntary and involuntary motor function and usually start on one side of the body. Symptoms are mild at first and will progress over time. Some people are more affected than others are. Studies have shown that by the time that primary symptoms appear, individuals with Parkinson’s disease will have lost 60% to 80% or more of the Dopamine-producing cells in the brain. Characteristic motor symptoms include4:

  • Tremors: Trembling in fingers, hands, arms, feet, legs, jaw, or head. Usually tremors occur while resting, but not while involved in a task. Tremors may worsen when a person is excited, tired, or stressed.
  • Rigidity: Stiffness of the limbs and trunk, which may increase during movement. Rigidity may produce muscle aches and pain. Loss of fine hand movements can lead to cramped handwriting (micrographia) and may make eating difficult.
  • Bradykinesia: Slowness of voluntary movement. Over time, it may become difficult to initiate movement and to complete movement. Bradykinesia together with stiffness can also affect the facial muscles and result in an expressionless, “mask-like” appearance.
  • Postural instability: Impaired or lost reflexes can make it difficult to adjust posture to maintain balance. Postural instability may lead to falls.
  • Parkinsonian gait: Individuals with more progressive Parkinson’s disease develop a distinctive shuffling walk with a stooped position and a diminished or absent arm swing. It may become difficult to start walking and to make turns. Individuals may freeze in mid-stride and appear to fall forward while walking.4

While the main symptoms of Parkinson’s disease are movement-related, progressive loss of muscle control and continued damage to the brain can lead to secondary symptoms. These secondary symptoms vary in severity, and not everyone with Parkinson’s will experience all of them, and may include. Anxiety, stress, confusion, memory loss or dementia, constipation, depression, difficulty in swallowing, excessive salivation, increased sweating, erectile dysfunction, skin problem, slowness of speech and monotone speech, incontinence of urinary or urgency for urination. 5

Several guidelines have been published to assist in the diagnosis of Parkinson’s disease. These include the Hoehn and Yahr scale and the Unified Parkinson’s Disease Rating Scale. Tests are used to measure mental capacity, behaviour, mood, daily living activities, and motor function. They can be very helpful in the initial diagnosis, to rule out other disorders, as well as in monitoring the progression of the disease to make therapeutic adjustments. Brain scans and other laboratory tests are also sometimes carried out, mostly to detect other disorders resembling Parkinson’s is disease.

The diagnosis of Parkinson’s disease is more likely if. At least two of the three major symptoms are present (tremor at rest, muscle rigidity, and slowness). The onset of symptoms started on one side of the body. Symptoms are not due to secondary causes such as medication or strokes in the area controlling movement. Symptoms are significantly improved with levodopa.

Researchers may disagree on the number of stages of Parkinson’s disease (range from 3-5 stages). However, they all agree the disease is a progressive disease with symptoms that usually occur in one stage may overlap or occur in another stage. The stage increase in number value for all stage naming systems reflects the increasing severity of the disease. The five stages used by the Parkinson’s Foundation are:

  • Stage 1: mild symptoms (tremors and/or movement symptoms like swinging arm while walking) do not interfere with daily activities and occur on one side of the body.
  • Stage 2: Symptoms worsen with walking problems and both sides of the body affected.
  • Stage 3: Main symptoms worsen with loss of balance and slowness of movement.
  • Stage 4: Severity of symptoms requires help; usually person cannot live alone.
  • Stage 5: Caregiver needed for all activities; patient may not be able to stand or walk and may be bedridden and may also experience hallucinations and delusions.5,6

Parkinson’s disease cannot be cured completely but the symptoms can be relieved with the use of various medication with carbidopa is usually given for the PD treatment, Carbidopa helps in delay of conversion of levodopa into dopamine. The nerve cells use levodopa for the production of dopamine and thus replenish the supply deficiency of the brain’s dopamine7.

Thus, levodopa is very helpful (at least ¾) of Parkinson’s cases. Not all Parkinson’s symptoms respond equally to this drug. Tremors don’t have much effect but bradykinesia and rigidity is remarkably reduced. Balance issues and other symptoms may not be alleviated at all. Anti-cholinergic have a great effect in controlling tremors and rigidity. Bromocriotine, Pramipexole and ropinirole, mimics the role of dopamine thus helping the neurons to use it as dopamine.8

An antiviral drug amantadine also helps in reducing the symptoms. In May 2006, FDA also approved the drug called Safinamide, which can be used for diminishing the experience of “off” periods or patients with increasing symptoms of PD. In some cases, surgery can also be done for the patients not responding well to drugs. Deep brain stimulation (DBS) is now approved by U.S FDA (Food and Drug administration) where an electrode is implanted in the brain and is connected to an electrical device called pulse generator which can be externally programmed.

 This process of stimulation reduces the need of drugs thus decreasing the involuntary movements call dyskinesia which is a common side effect of these drugs. This procedure of stimulation to brain also reduces tremors, slowness and gait disturbances. DBS requires careful programming in order to work correctly3, 8, 9.

Fall is very common in PWP. Gait impairment, freezing of gait, cognition, loss of postural control is the common cause of falling. This is not easily managed by medications only

Frequent falls can cause loss of mobility, restriction in daily living activities, fractures and cost of treatment is increased 10, 11.

Studies have shown that exercises can be useful in preventing falls in PwP (patients with Parkinson’s disease).

Physiotherapy along with drug therapy is the most commonly used procedure for PwP. However, the Cochrane reviews have supported this procedure with many randomized control trials 7, 8, 12.

Many authors have suggested that balance impairment in PD and normal old age changes causes decrease in the muscle strength due to their sedentary lifestyle. It has been noted that strengthening and balancing rehabilitation programs have reduced the risk of falls, prevent dysfunction and dependency in the elderly 13, 20, 21.

METHODOLOGY

Study design:  An Interventional Study

Study population: Subjects who are diagnosed with IPD by their Neurologist

Study setting: The study was conducted (testing & Intervention) at Outpatient department of Bethel Medical Mission HOSPITAL.

Study sample size A total of 30 patients

Sampling Method: Purposive sampling

 Study duration: 6 months

 Selection criteria

Inclusion criteria:

  • Diagnosed with IPD by their neurologist
  • Ambulatory and able to follow simple commands
  • Patient with Unified Parkinson’s Disease Rating scale score of 35 and above
  • Patient with a score of above 40% on the Activities Specific Balance Confidence Scale (ABC).
  •  

Exclusion criteria:

  • Suffering from unstable cardiovascular disease
  • Uncontrolled chronic conditions that might interfere with the safety and conduct of the training and testing protocol.
  • Patients participated earlier in balance and strengthening program

Outcome measures tools used for the study

  • The Berg Balance Scale (BBS)
  • The Activities-Specific Balance Confidence Scale (ABC)

Material used:  Data collection Sheets, Stop watch,15 ft Walk way, 4-inch Foam Pads, Thera bands, Chairs, Weight cuffs and Thera tubes.

 Methods: A total of 30 subjects fulfilling the selection criteria were included in the study after taking informed consent from each one of them. The Unified Parkinson’s Disease Rating Scale (UPDRS) Score is used for their eligibility.

The Unified Parkinson’s disease rating scale (UPDRS) has 4 sections

I-Mentation behaviour and mood

II- ADL activities

III- Motor examination

IV- Complication of therapy

Score – 0 to 147

Higher the score = Worst performance 12,15.

Baseline evaluation of Balance was be done using The Berg Balance Scale (BBS) Score, The Activities-Specific Balance Confidence Scale (ABC).

All participants received the same Balancing intervention and Muscle strength intervention for 6 months.  Outcome measurements of Balance and Muscle strength were assessed using The Berg Balance Scale (BBS), The Activities-Specific Balance Confidence Scale (ABC) at the end of 3 months & 6 months13,17.

Use of outcomes measures tools

All patients were evaluated at baseline and at the end of 3 months & 6 months of treatment period by the same examiner using Berg Balance Scale (BBS) 14 items (0-4 points per task higher score=best performance).

This scale evaluates balance during activities like sitting, standing and positional changes.

The Activities specific balance confidence scale (ABC) is the scale which examines patients perceived level of balance confidence while doing 16 activity of daily living rated from 0 to 100 each14, 16.

Procedure for intervention

Balancing exercise s were given thrice a week and strengthening exercises were given on remaining 3 days a week.

Thus, the duration for balance training was 30 minutes and strength training was for 15 minutes. Frequency of training – 3 days a week each for 6 days.

Balance Intervention:

Balance exercise session lasted for 30 min and was conducted on 3 non- consecutive days, every week. Balance training programme include standard rehabilitation exercises for balancing. This training improved balance in older adults with PD15, 16, 20.

Training was in 2 parts :

1.Standing on a 4-6-inch-thick foam pad with feet- shoulder width apart with eyes open and then eyes closed along with neck in neutral followed by neck extension for 20 sec. Repeated for 5 times.

2.Standing with feet – shoulder width apart without the foam pad with eyes open and then eyes closed along with neck in neutral followed by neck extension for 20 sec. Repeated for 5 times.

Muscle strengthening intervention:

Strengthening exercises were done with weight cuffs, TheraBand & Theratubes. All participants had undergone progressive strengthening of trunk, hip, knee, and ankle.

The training protocol used standard principle of rehabilitation of using concentric and eccentric muscles strength.

RESULTS

Primary analysis:

Pairwise comparisons were done for scores of BBS and ABCS using paired t-test.

Secondary analysis:

Correlation between Age and UPRSD was done using Karl Pearson’s correlation coefficient.

Comparison of change scores and UPRSD between gender was done using Independent t-test.

All analyses were done at 95% confidence interval using Statistical package for social sciences (SPSS version 22, Chicago, IL) for Windows software.

Tables and Graphs:

Table 1. Descriptive analysis
Table 2. Pre and post data analysis
Graph 1: Comparison of BBS by pre and post presentation
Graph 2: Comparison of BBS by pre and post on bar presentation
Graph 3: Comparison of activity based confidence scale on pre and post presentation
Graph 4: Comparison of activity based confidence scale on pre and post on bar presentation

Correlation between age and UPRSD:  Weak negative correlation existed (-.123) which was not statistically significant (p=.518)

Comparison of UPRSD between Genders:

Table 3: Comparison of UPRSD between Genders

Comparison of BBS and ABCS change scores between Genders:

Table 4: Comparison of BBS and ABCS change scores between Genders

BBS change score between 3-months and 6-months was better amongst women than men, statistically significant at p=.046. All other change scores were not influenced by gender (p>.05).

DISCUSSION

The main aim of the study was to evaluate disease specific and balance related measure in the given population. The clinical scales used in the study are sensitive in the evaluation of the risk of fall in patients with Idiopathic Parkinson’s Disease. Cut-off scores of these scales are very useful in clinical practice as it provides detailed description about impaired functional activities and balance related activities & can also be used to evaluate treatment outcomes.

The present study shows that balance and strengthening exercises together help in reducing risk of fall and improves functional mobility in patients with Idiopathic Parkinson’s disease.

In the study BBS and ABC pre and post test scores were analysed. It has been noted than all of the participants improved in their BBS and ABC scores.

BBS change score between 3-months and 6-months was better amongst women than men, & statistically significant at p=.046. All other change scores were not influenced by gender (p>.05). Similar study was done in the year 2003 & 2015 where they studied the Effect of balance and resistance training using computerized dynamic posturography (sensory orientation test) SOT for balance and muscle strength in 15 patients with IPD. Authors concluded that balance and strength of muscles can be improved in patient with PD by training programmes of balance and high intensity resistance 12, 19.

A systematic review study reported the evidence of resistance training on the strength and function in patients with PD. The study demonstrated that moderate intensity training for 2-3 times per week over 8-10 weeks can result in significant improvement in strength, balance and others motor symptoms in patients with early to moderate stage of PD18,20,21.

Another randomized control trial of 210 patients with PD were divided into 3 groups and were educated for balance training movement strategy training and strength training programs. The study concluded that rehabilitation training reduces the risk of falls in patients of mild to moderate stage of PD 19, 20

The present study results provide validation and best combination of outcome measures used in PD. With these scales risk of recurrent falls too can be determined. Although the patients performed well according to the scales, but an independent validation of sample is important in order to use into clinical practice.

Ethical clearance: The ethical approval was granted by the ethical committees of the Hosmat College of Physiotherapy, Bangalore.

Conflict of interest: There was no conflict of interest to conduct this study.

Fund for the study: It was self-financed study.

Limitations: Small sample size, smaller time period of study, Frequent follow up.

 Recommendations: Early stages of Parkinson’s and larger study size

CONCLUSION

The study result showed that Strengthening and balancing exercises have a great effect on patients with Parkinson’s disease. It delays the progress of the Disease and helps the patients to regain their confidence in mobility and become more active and independent. According to the statistical analysis female patients showed better response to the training as compared to the male patients.

REFERENCES

  1. Parkinson’s disease information page (January 18, 2019). National Institutes of Neurological Disorders and Stroke website. ninds.nih.gov/disorders/All-Disor ders/ Parkinsons Disease Information-Page. Updated June 12, 2108.
  2. Kalia L V. et al.(August 2015). Parkinson’s disease; 386(9996); 8; 96-912. PMID 25904081.
  3. Sveinbjornsdottir. S (Oct 2016). Quit;”The clinical symptoms of Parkinson’s disease” ; Journal of Neurochemistry.139 Suppl 1; 318-324; Bibcode: 2006JNeur. 26.9606G.
  4. Braak, H et al. (1998). Staging of brain pathology related to patients with Parkinson’s disease. C. An algorithm (decision tree) for the management of Parkinson’s disease. Neurology; 50 Suppl 3; S157.
  5. Poewe W (December 2006). “The natural history of Parkinson’s disease”. Journal of Neurology. 253 Suppl 7 (Suppl 7); VII2–6.
  6. Marchese R, Bove M, Abbruzzese G. (2003).Effect of cognitive and motor tasks on postural stability in Parkinson’s disease: a posturographic study. Mov Disord., 18; 652 658. 
  7. Deane KHO, Jones D, Ellis-Hill C, Clarke CE, Playford ED, Ben-Shlomo Y. (2001). Physiotherapy for Parkinson’s disease: A comparison of techniques. Cochrane Database Syst Rev. : CD002815.
  8. Deane KHO, Jones D, Playford ED, Ben-Shlomo Y, Clarke CE. (2001). (Physiotherapy versus placebo or no intervention in Parkinson’s disease. Cochrane Database Syst Rev. 3):CD002817.
  9. Olanow CW, Koller WC. (1998). An algorithm (decision tree) for the management of Parkinson’s disease. Neurology, 50 Suppl 3; S157.
  10. Chung CL, Thilarajah S2, Tan D3. (2016 Jan).  Effectiveness of resistance training on muscle strength and physical function in people with Parkinson’s disease: a systematic review and meta-analysis. Clin. Rehabil., 30(1); 11-23.
  11. Morris ME, Menz HB, McGinley JL, Watts JJ, Huxham FE, Murphy AT, Danoudis ME, Iansek R. (2015 Sep). A Randomized Controlled Trial to Reduce Falls in People With Parkinson’s Disease.Neurorehabil Neural Repair. 29 (8); 777-85.
  12. Conradsson D, Löfgren N, Nero H, Hagströmer M, Ståhle A, Lökk , Franzén E. (2015 Oct). The Effects of Highly Challenging Balance Training in Elderly With Parkinson’s Disease: A Randomized Controlled Trial. Neurorehabil Neural Repair., 29(9); 827-36.
  13. Corcos DM, Robichaud JA, David FJ, Leurgans SE, Vaillancourt DE, Poon C, Rafferty MR, Kohrt WM, Comella CL.(2013 Aug). A two-year randomized controlled trial of progressive resistance exercise for Parkinson’s disease. Mov Disord. 28(9); 1230-40.
  14. Olanow CW, Wunderle KB, Kieburtz K. (2011 May). Milestones in movement disorders clinical trials: advances and landmark studies.MovDisord.,26(6); 1003-14.
  15. Glendinning DS1, Enoka RM. (1994 Jan).  Motor unit behavior in Parkinson’s disease. Phys Ther., 74(1); 61-70.
  16. Smania N, Corato E, Tinazzi M, Stanzani C, Fiaschi A, Girardi P, Gandolfi M. (2010 Nov-Dec). Effect of balance training on postural instability in patients with idiopathic Parkinson’s disease. Neuro-rehabil Neural Repair.,24(9); 826-34.
  17. Qutubuddin AA, Pegg PO, Cifu DX, Brown R, McNamee S, Carne W. (2005 Apr). Validating the Berg Balance Scale for patients with Parkinson’s disease: a key to rehabilitation evaluation.Arch Phys Med Rehabil., 86(4); 789-92.
  18. Hirsch MA, Toole T, Maitland CG, Rider RA. (2003 Aug). The effects of balance training and high-intensity resistance training on persons with idiopathic Parkinson’s disease. Arch Phys Med Rehabil., 84(8); 1109-17.
  19. Inkster LM1, Eng JJ, MacIntyre DL, Stoessl AJ. (2003 Feb). Leg muscle strength is reduced in Parkinson’s disease and relates to the ability to rise from a chair. MovDisord. 18(2); 157-62.
  20. Scandalis , T , et al. (2001).Resistance Training and Gait function in patients with Parkinson’s disease. Am J Phys Med Rehabil. 80; 38.
  21. Glendinning, D: (2001). A rationale for strength training in patients with Parkinson’s disease. Neurology report (now JNPT); 21; 132.
Citation:   Purnima Singh, Panomootil Blessy Varghese (2020).effects of balance training and strengthening exercises on individuals with idiopathic parkinson’s disease, ijmaes;  6 (3); 799-810.

Effect of star excursion balance training program on agility among young men cricket players

Pushparaj Vijayakumar 1*, Rajavel Varatharajan 2, Jibi Paul3

Authors: 

2Faculty of Pharmacy, AIMST University, Semeling, 08100 Bedong, Kedah Darul Aman, Malaysia

3Professor,Faculty of Physiotherapy, DR.MGR.Educational and Research Institute, Deemed to be University, Velappanchavadi, Chennai, India

Corresponding Author:1*Professor, Rajarajeswari College of Physiotherapy, Kambipura, Mysore Road, Bangalore, Karnataka, India, Mail id: vijayrrc@yahoo.com

ABSTRACT

Background and objectives: The Cricket is known as “the gentleman’s game” which places physical demand on the players. This demand creates lot of stress on muscles leading to injuries if they lack fitness. Star excursion balance training (SEBT) programme forms a core component of the training among young men cricket players in improving their agility. The less research evidence on 6 weeks of SEBT program has led to design this study to identify whether there is any effect on agility in enhancing the physical performance and prevent the occurrence of injuries among young men cricket players.
Method: This was a comparative experimental study  conducted on thirty young men cricket players (n=30) of age group ranged between 18 and 22 years. They were randomly selected for two groups as star excursion balance training (SEBT), Group A and conventional exercises training (CET), Group B with fifteen (n=15) subjects in each group. The Group A underwent Star excursion balance training programme and the Group B underwent conventional exercises training programme. The training for both groups was administered for 6 weeks with three sessions per week.
Result: The result shows that there is significant improvement with P<0.0001 in agility T test score on performance in Group A and significant improvements in Group B, with P<0.0290. Comparative study between the group shows significant difference between the groups with P<0.0001, with mean difference of 0.060 and -1.453 respectively on Group A and B. So  Group A is better than Group B.  
Conclusion: Six weeks of star excursion balance training programme can be recommended for young men cricket players to improve the agility in enhancing their physical performance and preventing injuries.  

Keywords: Star excursion balance training, Agility T Test, Agility, Young men cricket players.

Received on 14th August 2020, Revised on 24th August  2020, Accepted on 31st  August 2020, DOI:10.36678/IJMAES.2020.V06I03.003

INTRODUCTION  

Cricket is one of the popular and oldest non-contact bat and ball sport which engages the players in running, throwing and catching during bowling, fielding, wicket keeping and batting. This leads to overuse and impact injuries to the upper limb, lower limb, head and back1. Cricket is one of the sports characterized by many of the basic and variable skills, which is played in several versions, such as long format and short format. The long format is played over for five consecutive days as test matches and the short format includes one day and 20-20 matches.

The demand on the players due to various formats of cricket sport causes physiological overload, which depends heavily on the player’s ability to move quickly and powerfully. This greater stress on the cricketers demands an extreme physical fitness, not only for the performance, but also to prevent injuries. These larger demands are the reflections of frequent touring for the test matches, one day matches and 20-20 matches per season. The sprinting and turning within the wickets , running-up and delivering the ball when fast bowling , causes rapid acceleration and deceleration load on the lower limb musculature2,3. The cause of stress in cricket players is due to sudden starting and stopping nature of sprinting between the wickets, fast bowling and fielding which contributes to onset of fatigue in overtime, resulting with impact of negative performance and increase in the risk of injuries. These intermittent activity in cricketers during bowling, fielding and batting, places them on demand on the physiological and neuromuscular system4,5.

The bat and ball sport led the players to, overuse and impact injuries , at various anatomical sites with the region most vulnerable to injury accounting with 44.9 % in the lower limb, followed by upper limb at 29.4%, the trunk at 20.0% and head and neck at 5.7%. The range of injuries in cricketers varied between 22.8 % to 50.0 % in lower limb among other anatomical sites of injuries6,7.The functional testing of balance and proprioception, strength, range of motion and agility determines whether a patient is able to return to play following an ankle injury8.

Due to the complex skills and rules in cricket, the players require a good physical fitness, skills and efficient strategies for an effective motor task performance in maintaining the body positions during sudden location and directional changes in activities of acceleration and deceleration which demands good balance. This task performance of sudden acceleration and deceleration rapidly with good balance and the ability to change direction or body position rapidly and to proceed with another movement is the ability defined as “Agility”9. The agility is the ability of a player to change position in space or to change direction quickly and effectively. And it is thought to be a reinforcement of programming through neuromuscular conditioning and neural adaptation of muscle spindle, golgi tendon organ and joint Proprioceptors10. The agility is a complex ability depending on coordination, mobility of joint system, dynamic balance, strength and speed. The balance training is effective in improving static postural sway and dynamic balance through neuromuscular control and performance enhancement11. This ability to enhance the maintenance or control of body positions while quickly changing the direction during a series of movements should improve “Agility”12.

The injuries can be an adverse outcome of participation in sports and recreational activities. The impact of injuries during these activities is most associated with cricket players at a value of 242/ 1000 injuries among other sport players. And it is recommended for injury prevention program, aiming at team ball sports (Cricket, soccer and netball) because of their comparatively high rate of both, overall and significant injury13

Training with rapid stretching of a muscle (eccentric action) immediately followed by a concentric or shortening action of the same muscle produces more force than the force produced by a concentric action alonebecause of the stored elastic energy within the muscle14, 15. The components of stopping, starting and changing direction in the training programs assists in developing agility10,16,17.  Training the above components through Star Excursion Balance Training (SEBT) among young men cricket players may be effective in improving the agility by increasing the balance and control of body positions during movements by neuromuscular conditioning and neural adaptation of the Proprioceptors10. But there are less scientific evidences in proving its effect. Therefore the purpose of this study is to determine whether there is any effect of SEBT program for 6 weeks on Agility among young men cricket players.

METHODS

This was an experimental and comparative study. Young men cricket players between the age group of 18 to 22 years, who were undergoing professional cricket training volunteered to participate in this study from the cricket academy at Bangalore. They were screened for selection criteria to include in this study. A total of 30 participants who satisfied the inclusion criteria were incorporated for the study after explaining the procedure and obtaining the signed written consent form. This study was a randomized controlled trial and the selected subjects were randomly allocated into two groups by paper and chit system, Group A (N=15) the training group and Group B (N=15) the control group.

Inclusion criteria: Young men cricket players of age group between 18 – 22 years, participants with agility T score of more than 11.5 seconds, and subjects with stroke balance stand test score of more than 40 seconds.

Exclusion criteria: Subjects withany limb length discrepancy, spinal or lower limb deformities, history of surgery of spine or lower limb or upper limb, history of injury of spine or lower limb or upper limb, history of neurological dysfunction in the lower limb or upper limb, vestibular dysfunction and any visual impairment were excluded from the study.

Materials: Measuring tape, White athletic tape, Four (4) agility cones, Stop watch, Paper and pencil were the materials used to conduct this study.

Measurement tools:  Agility T test used to measure the performance of cricket players

Intervention:  Star excursion balance training (SEBT) and Conventional exercises training (CET).

Procedures:

This study was designed with a pre and post intervention randomized control trial. Those subjects in training group (Group A) received star excursion balance training (SEBT) programme, while the subject in control group (Group B) received conventional exercises training program. The subject in both the groups were permitted to continue their regular cricket practice, but were not permitted to start any other extremity strengthening and balance training program during this course of study. Rather, they were permitted to perform only the approved training program of this study.

The subjects in both the groups were instructed to come in shorts and barefoot, one week before commencement of the study. They were explained and demonstrated to learn about the variables which have to be executed in the study and were made to practice in a correct manner. The Agility T-test was used as an outcome measure for Agility. On day one of the study, subjects in both the groups underwent a baseline testing as a pretest score and then a posttest score was measured on the last day of 6th week.

Dependent Variable Testing:

The agility T test is a reliable and valid measure for leg speed and secondarily of leg power and agility in lower limb20. The outcome measure was measured using agility T test. Before starting the test, four cones were taken and arranged on the track in the shape of “T”. The four cones A, B, C, & D were arranged perpendicular in the shape of “T”. The cones A and B were arranged perpendicular to Cones C & D. The point between Cone A and B was arranged in 9.14 meters and the point of arrangement between Cone C and D from Cone B was 4.57 meters. After the arrangement of cones the subject was made to stand with both the feet behind the starting point (Cone A) facing towards Cone – B. Then on getting a start signal and by starting the stopwatch, the subject ran from Cone – A towards Cone – B and touched the base of cone – B with the right hand. After touching Cone –B the subject ran towards Cone – C and touched the base of Cone – C with the left hand. Then the subject shuffled towards Cone – D to touch its base with the right hand. After this moment the subject shuffled back towards Cone –B and touched its base with the left hand followed by running towards Cone – A to finish. After crossing Cone – A, immediately the stopwatch was stopped and the total duration of time taken to complete the run between the cones was documented.

Group A: Star Excursion Balance Training (SEBT) group:

Prior to starting of the training program, the preparation for Star Excursion Balance training was performed, initially by selecting a flat and non-slippery surface. Then Four (4) strips of white athletic tapes of 6 feet in length were cut. In order to form the star grid shape on the floor, two strip were pasted in the form of “+” and the other two strips pasted across on the top in the form of “x”. It has to be assured that the stripes pasted are arranged to each other from a center point at angle of 45 degrees with each other. This star shaped grid arrangement involves a series of single-leg squats with the stance limb and a dynamic maximal reach using the non-stance limb to touch a point as far as possible along eight designated lines radiating from a central point at an angle of 45°18,19.

The subjects in the training group were informed to come in shorts and barefoot. To start with each training session the subjects were made to perform 3-minute of warm up followed by Star excursion balance training (SEBT) and conventional exercise training continued with 2-minute of cool down The warm up and cool down included dynamic movements and static stretches.

The subjects from the SEBT group performed the Star Excursion Balance training initially by standing in bilateral stance with barefoot on the middle of the star grid. The weight bearing leg is the stance limb and the unsupported leg is the reaching limb. Then the subjects were instructed to balance their body weight on the stance limb on the middle of the star grid where the strips of tapes are placed at an angle of 45 degrees. By keeping the hands on the pelvis, the subjects were made to reach a distance of 2 feet marked on the tape in all the 8 directional tape positions with the tip of toe of the reaching limb without shifting weight on the reaching limb. The 8 directional tape positions are anterior, anteromedial, medial, posteromedial, posterior, posterolateral, lateral, anterolateral. After each directional reach the subject returns the reaching limb to the start position at the middle of the grid, resuming a stable bilateral stance with 3 seconds of rest between each tape direction. The training with SEBT program was done with 12 rounds in clockwise and 12 rounds in counterclockwise reach. During each session, the subjects were given with a period of 30 seconds rest, to perform the same exercises by changing the stance limb and the reaching limb. The training was administered for 6 weeks with the frequency of three sessions per week.

Group B: Conventional Exercises Training (CET) group:

The subject in the conventional exercise training group performed the following exercises with 2 sets of 10 repetitions per day under the supervision. To start with each training session the subjects were made to perform 3-minute of warm up follow by Conventional Exercises Training (CET) continued with 2-minute of cool down. The warm up and cool down included dynamic movements and static stretches.

Two legs straight knees heel raise – Facing the wall: The subject was made to stand facing the wall with both knees in extended position. Both the feet’s were placed away by shoulder width and in front of a wall away by 6 inches with hands place on the wall at the level of the shoulder. The subject was instructed to raise the heel up on toes as high as possible and hold for a period of 10 seconds and relax for 10 seconds.

Two legs bent knees heel raise – Facing the wall: The subject was made to stand facing the wall with both knees in mild flexed position by placing the patella on the wall. Both the feet’s were placed away by shoulder width and in front of a wall away by 6 inches with hands place on the wall at the level of the shoulder. The subject was instructed to raise the heel up on toes as high as possible and hold for a period of 10 seconds and relax for 10 seconds.

Two legs straight knees heel raise- Facing away the wall: The subject was made to stand facing away from the wall with both knees in extended position. Both the feet’s were placed away by shoulder width and in front of a wall away by 12 inches. The subject was instructed to lean on the wall with the upper back and head supported and to raise the heel up on toes as high as possible while pushing the shoulder back into the wall and hold the heel raise for a period of 10 seconds and relax for 10 seconds.

Two legs bent knees heel raise- Facing away the wall: The subject was made to stand facing away from the wall with both knees in mild flexed position both the feet’s were placed away by shoulder width and in front of a wall away by 12 inches.  The subject was instructed to lean on the wall with the upper back and head supported and to raise the heel up on toes as high as possible while pushing the shoulder back into the wall and hold the heel raise for a period of 10 seconds and relax for 10 seconds.

One leg straight knee heel raise – Facing the wall: The subject was made to stand in unilateral stance facing the wall with the stance knee in extended position and foot in front of a wall away by 6 inches. Opposite foot is kept unsupported with hands place on the wall at the level of the shoulder. The subject was instructed to raise the stance heel up on toes as high as possible and hold for a period of 10 seconds and relax for 10 seconds.

One leg bent knees heel raise – Facing the wall: The subject was made to stand in unilateral stance facing the wall with the stance knee in mild flexed position by placing the patella on the wall and foot in front of a wall away by 6 inches. Opposite foot is kept unsupported with hands place on the wall at the level of the shoulder. The subject was instructed to raise the heel up on toes as high as possible and hold for a period of 10 seconds and relax for 10 seconds.

One leg straight knees heel raise- Facing away the wall: The subject was made to stand in unilateral stance facing away from the wall with the stance knee in extended position and feet in front of a wall away by 12 inches. Opposite foot is kept unsupported. The subject was instructed to lean on the wall with the upper back and head supported and to raise the heel up on toes as high as possible while pushing the shoulder back into the wall and hold the heel raise for a period of 10 seconds and relax for 10 seconds.

One leg bent knees heel raise- Facing away the wall: The subject was made to stand in unilateral stance facing away from the wall with the stance knee in mild flexed position and feet in front of a wall away by 12 inches. Opposite foot is kept unsupported. Lean on the wall with the upper back and head supported. The subject was instructed to lean on the wall with the upper back and head supported and to raise the heel up on toes as high as possible while pushing the shoulder back into the wall and hold the heel raise for a period of 10 seconds and relax for 10 seconds.

Forward and Reverse lunge: The subject was made to stand on the ground with your feet hip-width apart from each other. The both hands of the subject were on the side by holding 1kg dumbbells. Then the subject moved the left leg 1 foot forward simultaneously lowering the body until both the front and back legs comes to 90 degrees angle. Here it was instructed that the left leg should not go in front of your toes and at the same time, and also the back leg should not bend down the floor to touch it. Hold this position for 2-3 seconds. Rise above and take your left leg back to complete one rep. Repeat the same with the Right leg. To perform reverse lunges the subject was made to take the foot backward and then bend both legs down to get into a 90 degree angle. Repeat the same with the opposite leg.

RESULTS

The results of this study were analyzed in terms of the total time taken to complete the agility “T” test as an outcome measure indicated by improvement of agility by the enhancement of physical performance and thereby preventing injuries through efficient leg power, balance and speed of activity in the lower limb. The comparison was done between pretest and posttest data.

A total of 30 young male cricket players with age group between 18 to 22 years were included into two groups of SEBT group and CET group with 15 subjects in each. So as to evaluate the effectiveness of agility under this present study, both the intra group and inter group analysis (Group A and Group B) was done among the subjects who underwent star excursion balance training programme (Group A) and conventional exercises programme (Group B).

Within group analysis the improvement in agility T test score value for Group A on agility has reduced with mean difference of 1.747, with significant difference of P value  > 0.0001, while in Group B agility has reduced with mean difference of 0.233, with significant difference of P value < 0.029.

Table 1: Statistical analysis of Agility T test score Values in improving agility among subjects within Group A (SEBT group)
Table 2: Statistical analysis of Agility T test score Values in improving agility among subjects within Group B (CET group)
Graph 1: Presentation of the Agility T test score Values in the improvement of agility in subjects within Group A
Graph 2: Presentation of Agility T test score Values in the improvement of agility in subjects within the Group B

In between group Comparison of Group A and Group B, it has shown no significant difference on the pre- test agility score value with mean difference of 0.06000 and P value of < 0.561. However there was high significant difference in the improvement of post-test agility score value on agility with mean difference of -1.453 and P value of < 0.0001.

Table 3: Statistical analysis of pre Agility T test score values on agility in subjects between Group A and B

The above table 3 shows no significant difference in the pre-test agility score on agility among subjects between Group A and B with P value < 0.5914.

Graph 3: Presentation of Agility T test score on agility between pre-test score among subjects between Group A and B
Table 4: Statistical analysis of Agility T test score in the improvement of agility between post-test score among subjects between Group A and B

The above table 4 shows statistically significant difference in the post-test agility score in the improvement of agility among subjects between Group A and B with P value < 0.0001.

Graph 4: Presentation of Agility T test score Values in the improvement of agility between post-test score value of Group A and B

DISCUSSION

This present study was conducted to compare the effects of star excursion balance training (SEBT) programme versus conventional exercises training programme, in improving agility among young men cricket players. Our current study demonstrated that star excursion balance training (SEBT) administered for 6 weeks with the frequency of three sessions per week has showed statistical significant result in SEBT group and CET group on agility. On comparison between the groups, there was no statistical significant difference between the pre-test score values of agility T test but there was significant difference in effectiveness on agility between the post test score values between the groups. Here it is demonstrated with more effective on the mean difference among the SEBT group when compare with the mean difference on CET group.

This agility T-test is a reliable test for agility which is stated by Pauole et al., (2000)20 that, the agility T-test appears to be a reliable and valid measure of leg speed, leg power and agility which can be benefited as a field test to assess the lower extremity movement in ground based sports and discriminate between low and high levels of sport participation and also supported by Hermassi et al., (2011)21 concluded that total time of agility T-test is significantly associated with explosive muscular power of lower limbs, vertical jump performance and acceleration ability and its result suggest total time of agility T-test has an unique fitness quality to considered as field test that is relevant to be used in training prescription and talent identification.

Our data confirmed that there is improvement on the agility in the subjects of SEBT group through 6 weeks of star excursion balance training programme and less significant improvement on the agility with conventional exercise training programme as measured through Agility T test, which is similar to the previously reported finding by Rogers et al., (2012)22 stating that agility and perturbation are effective than resistance training to reduce and improve function postural control. The Inter group analysis of our study has shown with statistical significance, in improving the agility between the groups with more mean difference in SEBT group. This significant finding suggests that by performing star excursion balance training programme, there is associated contribution of training strength, training ability of balance, training ability of dynamic performance and training compressive loading over the joint in improving the functional performance with good Static and dynamic balance, efficient and quick change in direction of movement, skill to quickly stops and resume the movements which are the core components of agility.

The lesser improvement in agility among the subject in the conventional exercise training programme group may be due to less sensory input programme by dynamic loading on the limb while performing the conventional exercises. We therefore hypothesis that star excursion balance training (SEBT) programme is better than conventional exercises training programme (CET) and may contribute in improving agility among young men cricket players  for an efficient performance and prevention of injuries. Studies have adduced evidence by Rogers, Rogers, & Takeshima, 200523 who examined the effect of the ability to balance and stated that this effect of balance is entirely depended on sensory input and muscle strength .The sensory input occurs through visual, vestibular, and somatosensory systems. The visual system contributes to balance, by providing information about the environment, location, and the direction and speed of movement within the environment, whereas the vestibular system, give information about the position and movement of the head. The somatosensory system rules the position of the body and limb through information from receptors and muscle receptors and is similarly supported by Hasegawa et.al (2010)24 stated that the mechanoreceptors respond to any compression or tension during of loading over the limb and the afferent impulse are carried from periphery to central nervous system via spinal level, were it generates motor activity for protective mechanism of the respective joint.

These findings are similar to the findings of Matthews P B (1982)25 that proprioception is used for the regulation of total posture (postural equilibrium) and segmental posture (joint stability), as well as initiating several conscious peripheral sensations (“muscle senses”). This “muscle sense” sensations correspond to the contemporary terms joint position sense (posture of segment), kinesthesia (active and passive), and the sense of resistance or heaviness. Thus, proprioception correctly describes afferent information arising from internal peripheral areas of the body that contribute to postural control, joint stability, and several conscious sensations.

Furthermore, the statistical significance in star excursion balance training (SEBT) group on agility in our study could probably be due to the improvement in the components of postural control strategies. Indeed it has shown significant difference in improvement on agility among SEBT group rather than CET group.  Similarly, Chiung-Ling Chen (2014)26 stated that, in the initial phase, rotational perturbation induced earlier ankle movement and in faster and larger vertical center of mass displacement, while translational and forward/toe up perturbations induced larger head and trunk angular change and faster and larger horizontal center of mass displacement. In the reversal phase, balance reaction was attained by multi-joint movements. Translational and forward/toe up perturbations that induced larger upper body instability evoked faster muscle activation as well as faster and larger hip or knee joint movements.

Balance training, the amplitude, velocity and direction of perturbations can be varied to practice in-place or stepping reaction and normal strategy used to respond to an external perturbation can be trained to the patients to offer visions for selecting appropriate support surface perturbations for assessment and for designing methods for training postural control. These findings are similar to findings by Ogaya (2011)27that balance training in elderly people using wobble boards is effective to improve their standing balance by improving their standing time on a wobble board, on a balance mat, and maximum displacement distance of anterior-posterior center of pressure by which they frequently control their center of gravity and maintain a standing posture on unstable surface conditions. And the training on tilt board or uneven surfaces improves the ability to stabilize in an upright stance position. These postural exercises strategy restores body’s center of mass to stabilize through body movement centered primarily on the ankle joints and has significant impact on functional improvements in knee joint.

The result of this study was in compliance with the finding of the study conducted by Sporis et. al.,28 stated that agility training can be used effectively as a training method for improving explosive leg power and dynamic athletic performance. Hence in addition to the well-known method of training such as resistance training and plyometric training, strength and conditioning, athletes may incorporate agility training as well into an overall conditioning programme of athletes striving to achieve a high level of explosive leg power and dynamic performance. This is supported by Miller et al., 200629 that agility is the ability which makes it possible for an athlete to change direction, make quick stops and perform fast, smooth, efficient and repetitive movements and similarly a study conducted by Mayhew, et al. (1989)30 states that agility is highly dependent on coordination and movement control but apart from coordination there is a substantial number of factors that affect the level of agility such as mobility of joints, dynamic balance, power and flexibility, level of energy resources, strength, speed and optimal biomechanical structure of movement.

In an another study conducted by Islam (2004)31, analyzed the effect of an  exercise training program challenging the sensory and muscle systems in older adults on Static balance, dynamic balance, maximum excursion, and strength and concluded that there is significant improvement in balance, lower body strength and function. Boeer (2010)32 assessed the changes in balance capacities by recording the total center of pressure excursion with 1-legged stance on the oscillatory Posturomed platform after a 12-week sensory-motor training program for older adults with osteoarthritis and recommended that this training program improves balance abilities and reactions to sudden disturbances and displacements.

Ethical clearance: The ethical approval was granted by the ethical committees of the RRF cricket academy, Bangalore.

Conflict of interest: There was no conflict of interest to conduct this study.

Fund for the study: It was self-financed study.

CONCLUSION

The results of this study indicates that there is improvement on agility among young cricket players with Star excursion balance training (SEBT) program as assessed by the level of dynamic performance and functional tasks in different positions through agility T test. Ultimately, our study stresses the importance of improving the agility through efficient postural swaying strategies, rapid change of direction, explosive leg power, quick stopping and resuming smooth and repetitive movements.

Furthermore, this improvement in agility through SEBT can be a beneficial training programme in demanding the physiological and neuromuscular system among young men cricket players, in improving leg power, balance and speed in lower limb with the ability to sprint suddenly, quickly, powerfully and stop suddenly between the wickets with less impact on the risk of injuries. Therefore, conducting a planned SEBT programme can be recommended for cricket players to improve their agility for an efficient performance and less impact on the risk of injuries.

REFERENCES

  1. Dinshaw N. Pardiwala, Nandan N. Rao, Ankit V. Varshney. (2017). Injuries in Cricket. Sports Health.10:217-222.
  2. Noakes, TD. & Durandt, JJ. (2000). Physiological requirements of cricket. Journal of Sports Sciences, 18:919-929.
  3. Christie, CJ, Barford, G., Sheppard, B. (2011). Concentric and eccentric strength changes in the lower limb musculature following repeated sprints between the wickets. Proceedings of the 4th World Congress on Science and Medicine in Cricket. 31 March–01 April, 2011: 82.
  4. Davis .R, Du-Randt.R, Venter D, Stretch R.Cricket. (2008). Nature and incidence of fast bowling injuries at an elite junior level and associated risk factors. South African journal of sports medicine. 20(4): 115-119.
  5. Bartlett RM. (2003). The science and medicine of cricket: An overview and update. Journal of Sports Science. 21: 733-752.
  6. Stretch RA. (1993). The incidence and nature of injuries in first league and provincial cricketers. South African medical journal. 3: 339-342.
  7. Stretch R.A. (2003). Cricket injuries: A longitudinal study of the native of injuries in south Africa cricketers. British journal of sports medicine. 37: 250-253.
  8. Clanton, T. O., Matheny, L. M., Jarvis, H. C., & Jeronimus, A. B. (2012). Return to play in athletes following ankle injuries. Sports Health, 4(6), 471-474.
  9. Gabbard, Carl, Leblance, Elizabeth and Susan, (1987). Physical education for children. New Jersey: Prentice Hall, Inc. p. 120-124.
  10. Chaig.BW. (2004). What is the scientific basis of speed and agility? Strength and conditioning journal. 26 (3): 13-14.
  11. Zech, A., Hübscher, M., Vogt, L., Banzer, W., Hänsel, F., & Pfeifer, K. (2010). Balance training for neuromuscular control and performance enhancement: a systematic review. Journal of athletic training, 45(4), 392-403.
  12. Twist P.W., Benicky D. (1996).Conditioning lateral movements for multi-sport athletes: Practical strength and quickness drills. Strength and Conditioning 18(5):10-19
  13. Finch, C., & Cassell, E. (2006). The public health impact of injury during sport and active recreation. Journal of Science and Medicine in Sport, 9(6), 490-497.
  14. Baechle T.R., Earle R.W. (2000) Essentials of strength training and conditioning. 2nd edition Champaign, IL: National Strength and Conditioning Association. 
  15. Miller M.G., Berry D.C., Bullard S., Gilders R. (2002). Comparisons of land-based and aquatic-based plyometric programs during an 8-week training period. Journal of Sports Rehabilitation 11, 269-283.
  16. Miller, J.M., Hilbert, S.C. and Brown, L.E. (2001). Speed, quickness, and agility training for senior tennis players. Strength and Conditioning 23(5): 62-66.
  17. Young W.B., McDowell M.H., Scarlett B.J. (2001). Specificity of spring and agility training methods. Journal of Strength and Conditioning Research 15: 315-319.
  18. Gray, G. W. (1995). Lower extremity functional profile. Wynn Marketing, Incorporated.
  19. Gribble PA. (2003). The Star Excursion Balance Test as a measurement tool. Athl Ther Today. 8(2):46–47. 
  20. Pauole K, Madole K, Garhammer J, Lacourse M, and Rozenek R. (2000). Reliability and validity of the T-test as a measure of agility, leg power, and leg speed in college-aged men and women. J Strength Cond Res 14: 443–450,
  21. Hermassi, S., Fadhloun, M., Chelly, M. S., & Bensbaa, A. (2011). Relationship between agility T-test and physical fitness measures as indicators of performance in elite adolescent handball players. Pedagogics, Psychology, Medical-Biological Problems of Physical Training and Sports. 1 (5)125-130.
  22. Rogers, M. W., Tamulevicius, N., Semple, S. J., & Krkeljas, Z. (2012). Efficacy of home-based kinesthesia, balance & agility exercise training among persons with symptomatic knee osteoarthritis. Journal of sports science & medicine, 11(4), 751.
  23. Rogers, M.E., Rogers, N.L., & Takeshima, N. (2005). Balance training in older adults. Journal of Aging and Health. 1: 475–486.
  24. Hasegawa, R., Islam, M. M., Nasu, E., Tomiyama, N., Lee, S. C., Koizumi, D., & Takeshima, N. (2010). Effects of combined balance and resistance exercise on reducing knee pain in community-dwelling older adults. Physical & Occupational Therapy in Geriatrics, 28(1), 44-56.
  25. Matthews P B. (1982) .Where does Sherrington’s “muscular sense” originate? Muscles, joints, corollary discharges?             Annual Review of Neurosciences. 5:189–218. 
  26. Chiung-Ling Chen, Shu-Zon Lou, Hong-Wen Wu, Shyi-Kuen Wu, Kwok-Tak Yeung & Fong-Chin Su. (2014). Effects of the type and direction of support surface perturbation on postural responses.50,2-12.
  27. Ogaya, S., Ikezoe, T., Soda, N., & Ichihashi, N. (2011). Effects of balance training using wobble boards in the elderly. The Journal of Strength & Conditioning Research, 25(9), 2616-2622.
  28. Sporiš, G., Milanović, L., Jukić, I., Omrčen, D., & Sampedro Molinuevo, J. (2010). The effect of agility training on athletic power performance. Kinesiology: international journal of fundamental and applied kinesiology, 42(1), 65-72.
  29. Miller, M.G., Herniman, J.J., Ricard, M.D., Cheatham, C.C., & Michael, T.J. (2006). The effects of a 6-week training program on agility. Journal of Sports Science and Medicine. 5: 459-465.
  30. Mayhew, J.L., Piper, F.C., Schwegler, T.M., & Ball, T.E. (1989). Contributions of speed, agility and body compositionto anaerobic power measurements in college football players. Journal of Applied Sports Science Research. 3(4): 101-106.
  31. Islam, M. M., Nasu, E., Rogers, M. E., Koizumi, D., Rogers, N. L., & Takeshima, N. (2004). Effects of combined sensory and muscular training on balance in Japanese older adults. Preventive medicine, 39(6), 1148-1155.
  32. Boeer, J., Mueller, O., Krauss, I., Haupt, G., Axmann, D., & Horstmann, T. (2010). Effects of a sensory-motor exercise program for older adults with osteoarthritis or prosthesis of the hip using measurements made by the Posturomed oscillatory platform. Journal of geriatric physical therapy, 33(1), 10-15.
Citation:   Pushparaj Vijayakumar, Rajavel Varatharajan, Jibi Paul (2020).  Effect of star excursion balance training program on agility among young men cricket players , ijmaes;  6 (3); 784-798.


Practice of mothers to seek medical attention for their children with acute respiratory infection

E. Usha1, S Hepsibah Sharmil2*, R. Ruth Saranya3

Authors: 

1MSc Nursing Candidate, College of Nursing, Dr. M.G.R Educational and Research Institute, ACS Medical College and Hospital Campus, Maduravoil, Chennai, Tamil Nadu, India

3Associate Professor, College of Nursing, Dr. M.G.R Educational and Research Institute, ACS Medical College and Hospital Campus, Maduravoil, Chennai, Tamil Nadu, India

Corresponding Author:

2*Vice Principal & Research Scientist, College of Nursing, Dr. M.G.R Educational and Research Institute, ACS Medical College and Hospital Campus, Maduravoil, Chennai, Tamil Nadu, India Mail id: hepsibah.srs@drmgrdu.ac.in

ABSTRACT

Introduction: Practice of mothers is crucial to seek prompt medical attention especially for their under  five years of aged children and it reduces the mortality rate of the children with severe acute respiratory tract infection. The aim of this study was to determine health care seeking practice of the mothers and to analyze the factors influencing mothers choice in seeking care for there under five children.
Methodology: A cross sectional study was conducted at A.C.S Medical College at the three associated community health centers in Nasarathpettai, Meppur, Meppurthangal located at in Chennai. 251 mothers of under five children participated in the study.
Result: The study revealed that only 61.59% of children where promptly taken to the used to GP clinic for acute respiratory tract infection and 48.34% children were treated with home remedy, 29.14% used to take to general physician. It was found that 19.21% used old prescription given for the same child and 7.95% mothers seek over the counter drugs from medical shop.
Conclusion: Practice of health seeking behavior for acute respiratory infection among mothers of under five years children cannot be under estimated. It is the responsibility of the nurses and other healthcare people to create understanding on the management of acute respiratory tract infection to reduce further hazardous complication related to acute respiratory tract infection.    

Keywords: Under five children, acute respiratory infection, practice of mother, health care  

Received on 12th August 2020, Revised on 22nd August  2020, Accepted on 30th August 2020, DOI:10.36678/IJMAES.2020.V06I03.002

INTRODUCTION  

Acute respiratory infection (ARI) causes 20 % of the mortality among under five children1. However, ARI can be preventable and the intensity of the infection can be reduced if prompt medical care is sorted. ARIs causes more death and disease prevalence in children of under five years. More studies are proving that burden of ARI is present in both urban and rural area there are affect the low class and high class children’s in equally.

In the world under five deaths due to acute respiratory infection is the fifth leading cause. Globally, about 2 to six million (16%) ARI deaths are occurring in under five children. In India 1, 58,176 under five children’s are dies in acute respiratory infection (NHFWS 2018). The medical team gives priority care for children affected with ARI especially under five children. Because most of them under five children died in ARI disease burden is high. In India the major morbidity and mortality of children under five years deaths is caused by Acute Respiratory Tract infection. In India children under five years death due to acute respiratory infection in the year of 2018 is 882,000 which is 37 per 1000 live births 2, 3.

Acute respiratory infection is divided in to two category upper respiratory infection and lower respiratory infection. The upper respiratory indicates from the nose to larynx associated with the paranasal. The lower respiratory tract is at end of the upper respiratory to alveoli (trachea, bronchi, bronchioles and alveoli). Many studies have reported that appropriate care seeking behaviors is the is the best practice. Prompt care seeking behavior is reducing the 20% of the child death rates due to acute respiratory tract infection. The mother and other to give a proper time care that should be reduce the child mortality rate.     

Objectives of the Study : To assess the care seeking behaviour and practice of mothers for children with acute respiratory infection, also to associate the socio-demographic variables with mother’s care seeking behaviour  on under Five children with Acute Respiratory Infection 

METHODOLOGY AND METHODS

This was a community based cross– sectional study carried out in the three rural community health centers namely Nasarephpettai, Meppur and Meppurthangal which are affiliated to the tertiary level hospital at the local regions of Chennai in the state of Tamil Nadu, India. These Community health centers are located across 10 km radius away from ACS medical college. The community health centers affiliated to the tertiary level hospital are also located within 10 km between metropolitan regions of Chennai to rural land. The setting has been chosen on the basis of feasibility of adequate sample and cooperation. Population is the entire aggregation of cases which meet the designated set of criteria (Polit and Beck 2004).

The overall population of the total Nasarathaipettai population is 8409 under five children population 156. The Meppur and Meppurthangkal total population is 2182 under five children 83 the entire aggregation of cases which meet the designated set of criteria.

All the children, under five years of age belonging to the study area were included as study subjects. The mothers of the children were the respondents. Care was taken to ensure that the family of the particular under five was a permanent resident of the area and not a frequent migrant. Those who could not be contacted during the first visit were given two more visits. The research protocol was approved by the ethical committee at the ACS Medical College and Hospital and informed consent was obtained from each subject prior to inclusion in the study. A predesigned and pretested structured questionnaire was used to collect the data. The mothers were interviewed for detail information regarding socio-demographic details and acute illnesses especially ARI in last two weeks prior to the visit as these are the main contributors to child morbidity. The health care seeking behavior for such diseases including the place and person consulted for disease, the treatment availed, the money spent and the distance travelled were also enquired. Records were analyzed whenever available. Proportions and percentages were used for analysis.

Sample Size Calculation

4pq/L2   = 90 (+10 – 20%)

(Prevalence (6%), q= 1-p, L = allowable error (.05)

The Study sample comprised of 2512 under five mothers

Sampling Technique: Purposive sampling technique was used to select the sample

Selection Criteria: The Study includes mothers of less than five children; Mother’s who have already treated the acute respiratory infection for their children, Mother’s who are willing to participate and Mother’s who can speak and write Tamil and English.

Exclusion Criteria: Pilot study samples and children with other genetic problem and comorbidity. 

RESULT

The analysis is a process of organizing and synthesizing the data in such a way that the research questions can be answered and the hypotheses are tested. The analysis and interpretation of the data collected from 251 mothers of under five children to assess the care seeking behaivour of mothers of less than five children with acute respiratory infection. The data was organized, tabulated and analyzed according to the objectives. Data analysis begins with description that applies to the study in which the data are numerical with some concepts. Descriptive statistics allows the researcher to organize the data and to examine the quantum of information and inferential statistics is used to determine the relationship. 

Organization of the Data: Data organized under the following sections.

Section A:

Description of the demographic variables of mothers of under five children.

Section B:

Assessment of care seeking behaviour of mothers of less than five children with acute respiratory infection.

Section C:

Association of care seeking behaviour with selected demographic variables.

Section A:      

Description of the demographic variables of mothers of less than five children.


Table 1: Demographic variables of mothers of under five children (Continue…) 
Table 1: Demographic variables of mothers of under five children

The table 1 shows that the demographic variable number of living children had shown statistically significant association with level of care seeking behaviour among mothers of under five children with ARI at p<0.01 level and the other demographic variables had not shown statistically significant association with level of care seeking behaviour among mothers of under five children with ARI.

The table 1 depicts that regarding age of the child, most of them 117(46.61%) were aged 1 year to 3 years, 105(41.83%) of children were aged 3 years to 5 years, 25(9.96%) were aged 1 month to 1 year and 4(1.50%) were aged less than 1 month. Considering the sex of the child, most of them 135(53.78%) were male and 116(46.22%) were female. With respect to mother’s age, most of them 186(74.10%) were in the age group of     21 – 30 years, 63(25.10%) were aged 31 – 40 years and 2(0.60%) were in the age group of less than 20 years. Regarding the order of the child, most of them 132(52.59%) were 1st baby, 107(42.63%) were 2nd born baby and 12(4.78%) were 3rd born baby. With regard to number of living children, most of them 166(66.14%) had two living children, 57(22.71%) had one child and 28(11.16%) had three and above living children. Considering the religion, most of them 234(93.23%) were Hindus, 15(5.98%) were Christians and 2(0.80%) were Muslims.

Regarding the place of living, all 251(100%) were living in rural area. The total family income per month revealed that most of them 146(58.17%) had an income of 20000 -30000, 89(35.46%) had an income of 10000 and 16(6.37%) had an income of above 30000. With respect to family structure, 161(64.14%) were single parent family, 70(27.89%) belonged to nuclear family, 18(7.17%) belonged to extended family and 2(0.80%) belonged to joint family. With regard to mother’s education level, most of them 194(77.29%) had basic schooling, 33(13.15%) were graduates and 24(9.56%) were illiterates. Regarding the mothers occupation, most of them 239(95.22%) were housewives and 12(4.78%) were daily wages. Considering the culture, all 251(100%) belonged to Tamil culture. Preferred food choice revealed that most of them 239(95.22%) were non-vegetarian and 12(4.78%) were vegetarian. Regarding the awareness of ARI, most of them 193(76.89%) had the awareness of ARI and 58(23.11%) were not aware of ARI.

Considering the source of information, all 251(100%) received information through Health Worker. With respect to how often your child get’s ARI, most of them 182(72.51%) responded as less often (once in few month), 65(25.90%) responded as very often (every month) and 4(1.59%) responded as rarely (once a year). Regarding who takes care of ARI child, most of them 247(98.41%) responded as mother and 4(1.59%) responded as grandparent. Considering the foods (diet) given to the child during ARI, most of them 152(60.56%) had not at all given food, 70(27.89%) had given all fruits, 21(9.16%) had given fiber diet and only 6(2.39%) had given citrus fruits.

Graph 1: Percentage distribution of awareness about ARI among mothers of under five children with ARI. The 193 mothers are aware of ARI. 58 mothers are not aware of ARI

Section B: Assessment of care seeking behavior of mothers of under five children with acute respiratory infection.

Table 2: Frequency and percentage distribution of care seeking behaviour precursor for children with ARI

The table 2 shows that with regard to source of ARI, most of them 89(35.46%) don’t know about the source of ARI, 59(23.51%) responded as direct contact, 41(16.33%) responded as oral, 32(12.75%) responded as Vector C, 20(7.97%) responded as formite and 10(3.98%) responded as droplet. Considering the reason for not seeking medical help for ARI, most of them 173*68.92%) not at all seek medical help for ARI, 75(29.88%) used to try with home remedy like ginger/ honey/steam inhalation and only 3(1.20%) has not considered ARI is not a serious disease. Regarding the food choice you commonly give for ARI child, most of them 142(56.57%) used to give vegetarian and non-vegetarian  food, 61 (24.50%)  used  to

give only vegetarian food, 44(17.53%) used to give milk only, 3(1.20%) used to give only non-vegetarian and only one (0.40%) used to give no mild food.

The table 3 depicts that most of them 209(80.5%) had fever / increased body temperature i.e., 34% of the total responses, 202(80.5%) had irritation which constitutes 32.9% of the total responses, 130(51.8%) has nasal congestion / blocked nose i.e., 21.2% of the total responses, 30(12%) had difficulty in breathing which constitutes 4.9% of the total responses, 28(11.2%) had not able to drink or breast feed i.e., 4.6% of the total responses and 15(6%) had difficulty in breathing i.e., 2.4% of the total responses.

Table 3: Frequency and percentage distribution of symptoms of ARI among under five children
Table 4: Choice of care for mothers of under five children with ARI
Graph 2: Percentage distribution of where the ARI child be taken first by the mothers of under five children with ARI

The table 5 depicts that most of them 93(61.59%) used to take to the child specialist, 73(48.34%) used to try home remedy, 44(29.14%) used to take to general physician, 29(19.21%) used to follow old prescription of same child and 12(7.95%) used to take to medical shop. The table 3 depicts that most of them 209(80.5%) had fever / increased body temperature i.e., 34% of the total responses, 202(80.5%) had irritation which constitutes 32.9% of the total responses, 130(51.8%) has nasal congestion / blocked nose i.e., 21.2% of the total responses, 30(12%) had difficulty in breathing which constitutes 4.9% of the total responses, 28(11.2%) had not able to drink or breast feed i.e., 4.6% of the total responses and 15(6%) had difficulty in breathing i.e., 2.4% of the total responses.

Table 5: Frequency and percentage distribution of health seeking behaviour by mothers of under five children with ARI

The table 5 depicts that most of them 93(61.59%) used to take to the child specialist, 73(48.34%) used to try home remedy, 44(29.14%) used to take to general physician, 29(19.21%) used to follow old prescription of same child and 12(7.95%) used to take to medical shop. The table 6 shows that most of them 122(48.61%) had no effective health seeking behaviour, 66(26.29%) had taken prompt care and 63(25.10%) had taken delayed care.

Graph 3: Percentage distribution of health seeking behaviour by mothers of under five        children with ARI
Table 6: Multiple regression analysis to assess the influencing factors of care seeking behaviour among mothers of under five children with ARI with demographic variables.

The table 7 shows the binary logistic regression analysis to find out the association of demographic variables with health seeking behaviour. The table depicts that income had shown statistically significant association with health seeking behaviour with chi-square value of (c2=4.790, p=0.029)and with an odds of 1.764. This clearly infers that income influences 1.7 times the health seeking behaviour of mothers of under five children with ARI.

 The table depicts that awareness about ARI had shown statistically significant association with health seeking behaviour with chi-square value of (c2=4.940, p=0.026)and with an odds of 2.14. This clearly infers that awareness response of ‘Yes” influences 2.14 times the health seeking behaviour of mothers of under five children with ARI. The other demographic variables had not shown statistically significant association with health seeking behaviour of mothers of children with ARI.

DISCUSSION

Health seeking behavior for mothers for their child with ARI is vital. Various studies have shown that early health seeking prevents complications and equally reduces the rate of death. Studies from developing countries have reported that delay in seeking appropriate care and not seeking any care, contributes to the large number of child’s deaths4. Improving parents/caretakers health seeking behavior could contribute significantly to reducing child mortality in developing countries. The World Health Organization estimates that seeking prompt and appropriate care could reduce child’s deaths due to acute respiratory infections by 20%5. Early health seeking behavior for child’s acute health problem could reduce morbidity, short and long term complications of the child health problem, this is seen in the integrated management of childhood illness (IMCI) strategy, besides improving providers skills in managing childhood illness also aims to improve parents/caretakers health care seeking behavior. The health workers are trained to teach the mothers about danger signs and counsel them about need to seek care promptly if these signs occur6 .

 Epidemiologists and social scientist have devoted increasing attention to studying health-seeking behavior associated with the leading causes of child mortality, include respiratory infection. Health interview surveys conducted in different countries report varying results about the determinants of health seeking behavior during childhood illnesses (Thind & Cruz 2003). Various factors have been implicated as determinants of health seeking behavior of parents. Some studies have reported that care seeking behavior is predicted by house hold size, age and education of parents. Lack of access to health care due to high cost is perhaps the most common deterrent to optimal health care seeking in both rural and urban communities. Some studies have also shown that perceived illness severity, maternal recognition of certain signs and symptoms of childhood illness were critical factors determining health care seeking behavior7.

Mothers and Guardians as caretakers may also not seek for help or abstain from seeking care for their child health if they fail to recognize symptoms or do not consider them dangerous.  In addition, once a caretaker or parents has recognized illness and decide to seek care, house hold responsibilities and long distances to health units may still delay care seeking. When health care are sought, the quality of treatment or care received might not be adequate and may cause delay in subsequent seeking for the same health care. It is to this regards to reduce respiratory infection mortality, three crucial steps in management have been suggested by UNICEF8: recognize, seek and treat. These steps are equally important. Many child deaths could be averted if timely recognition of symptoms was followed by prompt care seeking at a place where accurate diagnosis would lead to administration of right drugs in correct doses9

In this present study the binary logistic regression analysis to find out the association of demographic variables with health seeking practice. The table depicts that income had shown statistically significant association with health seeking behaviour with chi-square value of (c2=4.790, p=0.029) and with an odds of 1.764. This clearly infers that income influences 1.7 times the health seeking behaviour of mothers of children under five years with ARI. The table depicts that awareness about ARI had shown statistically significant association with health seeking behaviour with chi-square value of (c2=4.940, p=0.026) and with an odds of 2.14. This clearly infers that awareness response of ‘Yes” influences 2.14 times the health seeking behaviour of mothers of under five children with ARI. The other demographic variables had not shown statistically significant association with health seeking behaviour of mothers of children with ARI. Infants (0–11 months) are more commonly cared by care takers rather than the parents and boys more than girls. Mothers below 35 years of age, who completed secondary education and those who marry at a young age, present with the good in terms of caring for their sick children. Mothers who received professional antenatal care have an advantage of bearing healthy children less prone to infections. Previous Studies found that maternal age has effect on care given to children in families in term of health. For rural residents, younger mothers aged between 15–34 years are said to be more active in seeking health care than for older mothers over 35 years of age. In urban residents, mothers less than 25 years old present with more health seeking behavior than those over 25 years of age. It is also reported that younger families are more exposed to media communications than older families due to a higher education level, which might contribute to broad information received on health issues leading to better health seeking behaviors by those young mothers. According to Mukandoli 10, young mothers and males were found to be associated with prolonged delay in seeking health care. Previous study also revealed that the health seeking behavior of a community determines how health services are used and in turn the health outcomes of populations.

Factors that determine health behavior may be physical, socio-economic, cultural or political. Indeed, the utilization of a health care system may depend on educational levels, economic factors, cultural beliefs and practices. Other factors include environmental conditions, socio-demographic factors, knowledge about the facilities, gender issues, political environment, and the health care system itself11. However, it is observed that socioeconomic, socio-cultural and demographic factors are often ignored while formulating health policies or any schemes for providing health care facilities to people. As a result, new schemes for providing health care services could not achieve its goal. Thus, health seeking behaviour is directed by socioeconomic, socio-cultural, and demographic factors, influence the health behaviour. In addition, according to Okwaraji et al12 in effect of geographical access to health facilities on child mortality in rural Rwanda: a community based cross sectional study, small sized families thought more about their children’s medical attention for respiratory infection in rural and urban residence as opposed to large families. Families with more than 4 children suffer more not only economically but also in regards to concentrated and time spent with their sick child. This reason was more pronounced with urban residences perhaps due to difference in average family members. In urban households average 3.7 persons compared to rural households with 4.9 persons.

Ethical clearance: The institution review committee of ACS Medical College and Hospital, DR MGR Educational and Research Institute, Chennai, has granted ethical clearance for the study with reference number 19/2019/IEC/ACSMCH dated 09/10/2019.

Conflict of interest: There was no conflict of interest to conduct this study.

Fund for the study: It was self-financed study.

CONCLUSION

The study concluded that most of them 93(61.59%) used to take to the child specialist, 73(48.34%) used to try home remedy, 44(29.14%) used to take to general physician, 29(19.21%) used to follow old prescription of same child and 12(7.95%) used to take to medical shop.

The results can help the health seeking behavior on acute respiratory infection among under five mothers understand various aspects of self-management and other health care personal managements of under-five mothers and follow up13, 14. It is the responsibility of the nurses15 to create understanding on the management of acute respiratory tract infection of  to reduce further complication related to acute respiratory tract infection.

REFERENCES

1. Dagne, H., et al., (2020). Acute respiratory infection and its associated factors among children under-five years attending pediatrics ward at University of Gondar Comprehensive Specialized Hospital, Northwest Ethiopia: institution-based cross-sectional study. BMC pediatrics,20(1): p.1-7.

2. Krishnan, A., et al., (2015). Epidemiology of acute respiratory infections in children-preliminary results of a cohort in a rural north Indian community. BMC infectious diseases, 15(1): p. 1-10.

3. Imran, M., et al., (2019). Risk factors for acute respiratory infection in children younger than five years in Bangladesh. Public health, 173: p. 112-119.

4. Sreeramareddy, C.T., et al., (2006). Care seeking behavior for childhood illness-a questionnaire survey in western Nepal. BMC international health and human rights, 6(1): p. 7.

5. Källander, K., et al., (2008). Delayed care seeking for fatal pneumonia in children aged under five years in Uganda: a case-series study. Bulletin of the World Health Organization, 86: p. 332-338.

6. Stewart, M.K., et al., (1993).Acute respiratory infections (ARI) in rural Bangladesh: perceptions and practices. Medical anthropology,. 15(4): p. 377-394.

7. Ferdous, F., et al., (2014). Mothers’ perception and healthcare seeking behavior of pneumonia children in rural Bangladesh. ISRN family medicine.

8. Mathew, J.L., et al., (2011). Acute respiratory infection and pneumonia in India: a systematic review of literature for advocacy and action: UNICEF-PHFI series on newborn and child health, India. Indian pediatrics, 48(3): p. 191.

9. Williams, B.G., et al., (2002). Estimates of world-wide distribution of child deaths from acute respiratory infections. The Lancet infectious diseases, 2(1): p. 25-32.

10. Mukandoli, E., (2017). Health seeking behaviors of parents/caretakers of children with severe respiratory infections in a selected referral hospital in Rwanda. University of Rwanda.

11. Francis Jebaraj, H.S., (2015).Stopping the run-around: addressing Aboriginal community people’s mental health and alcohol and drug comorbidity service needs in the Salisbury and Playford local government areas of South Australia.

12. Okwaraji, Y.B., et al., (2012). Effect of geographical access to health facilities on child mortality in rural Ethiopia: a community based cross sectional study. Plos one, 7(3): p. e33564.

13. Hepsibah S Francis, Unit 4; (2020). Guidance and Counciling in Essentials of Commun-ication and Educational Technology for BSc Nursing, K.C. Gopichandran. L, Editor. CBS Publishers and Distributors Pvt. Ltd. : Delhi.

14. Sharmil, H., (2019).Health Information Technology Media by Nurses in Patient Care. International Journal of Linguistics, Literature and Translation, 2(2): p. 290235.

15. Sharmil,S.H.,(2011). Awareness of Commu- nity Health Nurses on Legal Aspects of Health Care. International Journal of Public Health Research,(Special issue): p. 199-212.

Citation:  E. Usha, S Hepsibah Sharmil, R. Ruth Saranya (2020). Practice of mothers to seek medical attention for their children with acute respiratory infection, ijmaes;  6 (3); 770-783.

A brief review in non-specific low back pain: Evaluation and physiotherapy intervention

Lucky Anggiat1*

Author:

1Physiotherapy Program, Fakultas Vokasi, Universitas Kristen Indonesia, Indonesia

Corresponding  Author :

*1Physiotherapy Program, Fakultas Vokasi, Universitas Kristen Indonesia, Indonesia

Mail id: lucky.panjaitan@uki.ac.id

ABSTRACT

Background: Low back pain was the most common case in musculoskeletal disorders. Non-specific low back pain (NSLBP) described as low back pain with no clear causal relationship between the symptoms, physical findings, and imaging findings. This study aimed to briefly review the evidence the evaluation and intervention for NSLBP in physiotherapy practice.
Methods: In this study, the library research method was used, which took online and offline data sources referring to books, journals, articles related to the topic of evaluation and physiotherapy intervention in NSLBP conditions as a data source to answer research objective
Results: Some researchers commonly assess the pain, range of motion (ROM), functional ability and quality of life. As a regular treatment for non-specific low back pain, some study recommended general therapeutic exercise and manual therapy to reduce the problematic of non-specific low back pain.
Conclusion: Physiotherapist can evaluate patients with NSLBP based on the patients complains like pain using VAS or NPRS, Lumbar ROM using schober method, functional disability using ODI or RMDQ and Quality of life. For the physiotherapy intervention of non-specific low back pain, we can summarize that the first-line management of NSLBP is self-management exercise. Furthermore, physiotherapist can use any method of therapeutic exercise and manual therapy to reduce pain, improve lumbar ROM, increase functional ability and quality of life.  

Keywords: Non-specific Low Back Pain, Evaluation, Intervention, Physiotherapy

Received on 08th August 2020, Revised on 22nd August  2020, Accepted on 29th August 2020, DOI:10.36678/IJMAES.2020.V06I03.001

INTRODUCTION

Low back pain was the most common case in musculoskeletal disorders 1. The challenge when managing the low back pain was diagnosing the low back pain and choose the treatment 2. In general, the low back pain consists of two types, which is specific and non-specific low back pain (NSLBP). Low back pain with specific type can be divided into low back pain that related to vertebrae and non-vertebrae. In the other hand, NSLBP described as low back pain with no clear causal relationship between the symptoms, physical findings, and imaging findings 3. In addition, NSLBP is classified into low back pain, which is not related to the neurological problem and degenerative syndrome 4.

Previously, some research showed that NSLBP mainly affected the young population. Non-specific low back pain has also increased in the general community, which have affected the adolescents and middle-aged worker 5. Nordin et al. reported that the incidence of NSLBP among undergraduate student in health sciences programs was 40.3%, the incidence was associated with the age, years of study, physical fitness, and hours they spent sitting in the classroom 6. Another research by Anggiat et al. showed a similar result that students in a university experience NSLBP with 74.6% 7. Also, a community-based program revealed that teachers also experience low back pain with more than half of the teacher population 8.

Numerous research already conducted to evaluate the non-specific low back pain. The most common evaluations were pain assessment, trunk flexibility, functional ability and quality of life 9,10,11. Those evaluations seem to be correlated with the population which experienced NSLBP because the NSLBP mainly causes pain, reduced flexibility of trunk movement, functional limitation and sometimes also affected to quality of life 12. Furthermore, most studies also conducted in the physiotherapy intervention for NSLBP. Physiotherapy was the first line care to give intervention in person who experienced NSLBP 13. Some research was done resulting recommendation of using home exercise program, manual therapy and general exercise therapy 2, 14, 15.

From the background, this study aimed to briefly review the evidence the evaluation and intervention for NSLBP in physiotherapy practice. In addition, with this article, the physiotherapist will easily use the evidence to treat the non-specific low back pain.

METHOD

In this study, the library research method was used, which took online and offline data sources referring to books, journals, articles related to the topic of evaluation and physiotherapy intervention in NSLBP conditions to answer research objective. The use of books is focused on basic science such as evaluation and applied anatomy. In the intervention, articles in journals and clinical guidelines were used that recommend physiotherapy in NSLBP conditions. The searching strategy was conducted a literature search using the online database in google scholar for ‘‘physiotherapy for non-specific low back pain’’ The bibliographies of particularly relevant articles were searched as well.

RESULT AND DISCUSSION

Applied anatomy and contributing factor of NSLBP: Non-specific low back pain mainly related with posture or poor body mechanic. There are several other factors caused the NSLBP with anatomical problem. Some anatomical related factors can be contributed to the incidence of NSLBP. Lumbar flexion motion is performed by rectus abdominis, external and internal oblique. For extension motion is performed by illiocostalis, longissimus, semi spinalis, multifidus. For lateral flexion motion, performed by quardatus lumborum and also assisted by illiocostalis, longissimus, spinalis. For rotation motion, the prime mover is tranversus abdominis, and multifidus work contralateral for every rotation motion 16. Some muscles of the back that related with the low back pain are tranverse abdominis, internal obliques, erector spinae and multifidus. Those muscles will indicate low back pain problem if the muscle has poor muscular endurance, which is related with, prolonged posture activity 17. Currently, multifidus muscle dysfunction is being implicated as a contributory factor in the development or recurrence of sub-acute and chronic back pain 18.

In general, NSLBP has two classifications; an acute stage, which pain lasts less than 12 weeks and chronic stage, which pain lasts more than 12 weeks 19. According to Taguchi, chronic NSLBP was due to physiological structural fragility in lumbar region, and often caused by improper posture, which can be called a living functioning impairment 4. A research showed that mobility of the spine reduced causing disorders in muscle synergies and consequently increased the energy cost of maintaining postural ability 14.

One of the causes of NSLBP is postural pain caused by prolonged sitting activity for about 2 hours a day, which causes increased discomfort in the body 20,21. Sitting in a slumped position is also associated with fatigue in the internal oblique muscles and/or transverse abdominis which keeps the spine in one position so that it makes these muscles prone to injury and can also be caused by atrophy of the multifidus and para-spinal muscle 21.

Another study also reported that sitting in a position such as the excessive kyphotic posture with frequent lumbar flexion or the excessive lordotic posture with too much extension can result in low back pain 22. A study in Japan, it was reported that 22% of the population aged 20-85 years had NSLBP 23. In line with several other studies, it also reported that students, office workers and teachers also experience NSLBP due to prolonged sitting for at least 3 hours a day 6,7,8. The pain produced by NSLBP in a population of both students, teachers and office workers can affect physiological and psychological stress and sometimes cause secondary disturbances in the form of decreased quality of life 4, 5.

Evaluation for NSLBP: To assess the effect of low back pain to individual life, the physiotherapist will carry out several assessments to evaluate low back pain and its impact. Some researchers commonly assess the pain, range of motion (ROM), functional ability and quality of life 9,10,15,24. Physiotherapist commonly uses the visual analogue scale (VAS) to assess the pain perception of low back pain 15, 25. In a study by Hawker et al. shouted that the VAS is self-completed by the respondent.

They also mentioned that the VAS is widely used due to simplicity and adaptability to a broad range of population and settings 26. As a subjective measurement of pain, VAS consists of a 10 cm line with two end-points representing ‘no pain’ and ‘worst imaginable pain’. Patients will have asked to rate their pain by placing a mark on the line corresponding to their current level of pain 27.

The VAS is a well-known assessment tool for pain and recommended as a means of rating the subjective pain 20. Another version with the same meaning of VAS, physiotherapist can use Numeric Pain Rating Scale (NPRS) which consist of number 0 for no pain until 10 which worst worst imaginable pain. Physiotherapists can use either of these pain evaluations because those pain evaluation tool have the same validity and reliability 26.

As the pain was assessed in the non-specific low back pain, another assessment that related with pain was the flexibility of the lumbar spine, where the pain will affect the flexibility of lumbar spine 28. Furthermore, a study by Wong and Lee describes that there is a correlation between patients with LBP and the decreased lumbar ROM 29. The flexibility of the lumbar spine is related to the lumbar range of motion (ROM). They also conclude that the lumbar ROM should be evaluated after the treatment of LBP to know the effects of the treatment. Previously, some researcher decided to use a measuring tape to evaluate the lumbar ROM 10,30. Tape measurements were the least expensive method to measure spinal movement and perhaps the easiest to use 31. In order, to measure flexion and extension of lumbar, the modified Schober method can be used by the physiotherapist 32. Some studies also reported that the Schober method was one of the good methods to assess the lumbar flexibility 32, 33.

In order, to measure lateral flexion, the fingertip-to-floor method can be used as an additional measurement of lumbar ROM 31. However, flexion and extension were the most commonly used as the main evaluation of the lumbar range of motion in low back pain cases 10, 34.Clearly, the flexion and extension movement is the main segmental movement of the lumbar spine 35.

The risk of people with NSLBP who have high pain score may also develop functional disability 36. Furthermore, to evaluate disability, should to use disability measurement along with pain measurement. In other studies, it was reported that pain was also associated with impaired functional activity, which in this case could cause disability, where a high rate of disability was associated with high pain rates 37. Activity disorders that can occur in patients with NSLBP are activities indoor and outdoor activity such as on travelling, climbing and descending stairs, walking, wearing clothes, eating, using the toilet, using public transportation and other social activities 38.

Several studies provide recommendations using the Oswestry Disability Index (ODI) for assessment of functional disability caused by LBP 39,40,41. The Oswestry disability index (ODI) is aimed specifically at LBP conditions and is the best standard in evaluating the functional activity of people with NSLBP both before and after the intervention 39. Furthermore, research from Fairbank and Pynsent stated that ODI has been translated into several languages including English and can then be used validly and reliably for examining conditions of back pain related to disability evaluation 42.

On the other hand, other evaluation related to functional activities, the physiotherapist can use the Rolland-Morris Disability Questionnaire (RMDQ) 43. In general, RMDQ also has similar validity and reliability to ODI, but in detail, ODI is still superior in evaluating NSLBP patients 44, 45.

Furthermore, the RMDQ is still considered a very useful evaluation tool in evaluating the condition of NSLBP patients. Similar to ODI, RMDQ also evaluates the patient’s status in terms of pain, dysfunction and disability 43. Thus, evaluation before and after the intervention can be carried out using the questionnaire to see the changes that occur before and after the intervention.

Non-specific low back pain with a long period of time can affect the quality of life. Pain that is quite severe has contributed to reducing the quality of life of an individual 46. Furthermore, in their study, it was concluded that the LBP condition was quite severe and reduced activity was also associated with physical functional disorders and even caused mental disorders and individual productivity.

Followed by other research by Tsuji et al. also reported that the condition of pain was quite high and disturbances in quality of life affected the decrease in productivity of workers with NSLBP 47. Furthermore, they also suggested to be able to evaluate the quality of life of individuals who have NSLBP as an essential examination. In field of education, Kennedy et al. also reported that students with LBP affect their quality of life by decreasing psychosocial aspects such as experiencing sadness, being overwhelmed and exhausted 48.

Evaluation of quality of life generally uses the Health-related quality of life (HRQoL) questionnaire. The questionnaire in the quality of life examination is generally classified into generic, condition specific, or patient specific. In evaluating the HRQoL in low back pain population, the condition-specific instrument of HRQoL can be used.

The HRQoL is a multidimensional concept that refers to function and well-being on various dimensions of health, including physical, emotional, social and spiritual aspects of life 49. Some of the HRQoL instruments that can be used to assess the quality of life on low back pain patient is the Short Form 36-items Health Survey (SF-36) or with other short versions such as SF-12 or SF-8 50.

Physiotherapy Intervention: As a regular treatment for non-specific low back pain, some study recommended general therapeutic exercise to reduce the impairment of NSLBP  51, 52. The type of general exercise for low back pain mainly is an active stretching, which easily performed by the patient 53. A study by Gawda et al. revealed that the stretching therapy that done by the patients could be effective to reduce the low back pain 14. In their study, the physiotherapist gives some example to do the stretching until the patients can do the stretching by themselves. Some guidelines, also reported some educational exercise that can be done by the low back pain patient to manage the low back pain 19,54. In 2016, National Institute for Health and Care Excellence (NICE) produce an assessment and management guideline for the low back pain. In that guidelines, described that the self-management was the first management for low back pain 13.

A review study by Bardin, King and Maher also recommended self-management exercise along with hot-pack as the first line care for NSLBP 2. The use of hot packs considered as a pain relief that provides analgesia effect and muscle relaxation 2,55. Self-management exercise or educational home exercise program with hot packs also recommended by a health care guideline as a management of low back pain patient 54. A research by Taguchi stated that the therapeutic heating is often conducted by physiotherapy for the chronic NSLBP, despite the effectiveness in not clear, however, from the viewpoint of relaxation, the purpose of therapeutic heating is reducing the pain 4.

Furthermore, several clinical guidelines provide recommendations for interventions in the management of LBP in clinical practice. In America, the clinical practice guidelines made by the American Physical Therapy Association (APTA) recommend several interventions that can be used in general in LBP patients 43.

The first recommendation is to use manual therapy with joint mobilization or thrust manipulation to reduce pain and disability. Then, for therapeutic exercise intervention is recommended using back-specific strengthening, coordination and endurance exercises. Those two recommendations are based on strong recommendations. In addition, it is also recommended to use patient education/counseling for disruption of activities due to LBP and increase endurance with fitness and endurance activity based on moderate and strong recommendations.

Another clinical recommendation in the United Kingdom also provides several options in physiotherapy intervention in LBP conditions 13. In addition to using self-management exercises, physiotherapists are also recommended to use exercise therapy such as exercises based on biomechanics, aerobics or in combination with other types of exercise. Just like in APTA guidelines, in the next recommendation, physiotherapy is also recommended using manual therapy such as mobilization or spinal manipulation and also soft tissue manipulation. Besides, they also recommend using psychological therapy such as the cognitive-behavioral approach in combination with exercise therapy or manual therapy.

In a study by Oliviera et al. that reviewed clinical practice guidelines for the management of NSLBP, recommended several suggestions related to physiotherapy interventions in NSLBP 56. In general, in the types of physiotherapy interventions, they recommend exercise therapy for the management of both acute and chronic NSLBP. Although the types of exercise therapy are still considered inconsistent, physiotherapists can use various types of exercise therapy according to the therapist’s ability. Subsequently, manual therapy with spinal manipulation has also become a recommended intervention in the management of both acute and chronic NSLBP.

In manual therapy, the physiotherapist can choose to use spinal mobilization or manipulation, however, exercise therapy has several types of methods that can be used according to the physiotherapist’s ability to perform the methods 13,43. Exercise therapy that can be recommended is the motor control exercise approach and core stability exercises 57,58. Exercises using a flexion and extension approach as known as the directional preference of McKenzie method or the other name is Mechanical Diagnosis and Therapy (MDT) can be used as well 59.

Furthermore, exercise therapy with a proprioceptive approach such as Proprioceptive Neuromuscular Facilitation which is rarely used in musculoskeletal cases, can be used in NSLBP patients as well. All types of exercise therapy have a beneficial effect in reducing pain, increasing lumbar ROM and improving functional activity and quality of life with no superiority among each other methods 41,60.

This study is a simple short review study in the evaluation and intervention of physiotherapy in NSLBP conditions. There are still many limitations in this research, so that, in the future, a more comprehensive review study method should be carried out.

CONCLUSIONS

Numerous research has been able to provide very useful information to the physiotherapist to evaluate and treat the patients with NSLBP. Based in this present study, we can conclude that physiotherapist can evaluate patient with NSLBP based on the patient’s complaints such as pain using VAS or NPRS, Lumbar ROM, functional disability using ODI or RMDQ and quality of life questionnaire.

For the physiotherapy intervention of NSLBP, we can summarize that the first-line management of NSLBP is self-management exercise. Furthermore, physiotherapist can use any method of therapeutic exercise and manual therapy to reduce pain, improve lumbar ROM, increase functional ability and improve the quality of life.

Conflict of interest: The author has no conflict of interest to declare.

Funding of study: This study has no funding or sponsorship was received. It is self-financed study.

Compliance with Ethics: This study based on review of previous conducted studies with does not contain any studies with human or animals.

REFERENCES

  1. Maher, C., Underwood, M., Butchbindee, R. (2017). Non-specific low back pain. Seminar, Lancet 389: 736-47
  2. Bardin L, D., King P., Maher C, D. (2017). Diagnostic triage for low back pain    : a practical approach for primary care. The Medical Journal Australia 206 (6), 268-273.
  3. Balagué, F., Mannion, A. F., Pellisé, F., & Cedraschi, C. (2012). Non-specific low back pain. The lancet, 379(9814), 482-491.
  4. Taguchi, T. (2003). Low back pain in young and middle-aged people. Journal of Japan Medical Association. JMAJ, 46(10): 417-423.
  5. Aziz, S., Ilyas, S., Imran S., Yamin F., Zakir A., Rehman A., Adnan S., Khanzada S. (2016). Effectiveness of McKenzie Exercise in Reducing Neck and Back Pain Among Madrassa Student. International Journal Physiotherapy 3 (1), 78-85.
  6. Nordin, N. A., Devinder, A. S., & Kanglun, L. (2014). Low Back Pain and Associated Risk Factors among Health Science Undergraduates. Sains Malaysiana, 43(3), 423–428.
  7. Anggiat, L., Hon, W. H. C., & Baait, S. N. (2018). The incidence of low back pain among university students. Pro-Life, 5(3), 677-687.
  8. Budhyanti, W., Anggiat, L., & Juwita, C. P. (2020). Pencegahan dan penanganan nyeri leher dan punggung bawah dengan peregangan mandiri pada pegawai sekolah menengah kejuruan negeri 10 cawang. Jurnal Fisioterapi dan Rehabilitasi,  4(1), 79-89.
  9. Dhaliwal, M. K., Amandeep, Jagmohan., Manjeet. (2014). To compare the effect of proprioceptive neuromuscular facilitation program versus core stabilization exercise for decreasing pain and improving function in patients with low back pain. IOSR Journal of sport and physical education 1. PP 29-35.
  10. Park, K.Y., Seo, K.Y. (2014). The Effects on the pain index and lumbar flexibility of obese patients with low back pain after PNF Scapular and PNF pelvic patterns, Journal of Physical Therapy Scienes 26 : 1571-1574.
  11. Anggiat, L., Hon, W. H. C., & Sokran, S.N.B.B.M. (2018). Comparative effect of proprioceptive neuromuscular facilitation and mckenzie method on pain in non-specific low back pain among university population. International Journal of Medical and Exercise Science, 4(3), 475-485.
  12. Pergolizzi, J. V., & LeQuang, J. A. (2020). Rehabilitation for Low Back Pain: A Narrative Review for Managing Pain and Improving Function in Acute and Chronic Conditions. Pain and Therapy, 1-14.
  13. National Institute for Health and Care Excellence (NICE). (2016). Low back pain and sciatica in over 16s: assessment and management. United Kingdom : NICE Guidelines. nice.org.uk.
  14. Gawda P, Dmoszyńska-Graniczka M, Pawlak H, Cybulski M, Kiełbus M, Majcher P, Buczaj A, Buczaj M. (2015). Evaluation of influence of stretching therapy and ergonomic factors on postural control in patients with chronic non-specific low back pain. Annals of Agricultural and Environmental Medicine 22(1): 142-146.
  15. Waqqar, S,. Rehman S, S., Ahmad, S. (2016). McKenzie treatment versus mulligan sustained natural apophyseal glides for chronic mechanical low back pain. Pakistan Journal of Medical Sciences 32(2):476-479.
  16.  Cael, C. (2010). Functional Anatomy: musculoskeletal anatomy, kinesiology, and palpation for manual therapists. Lippincott Williams & Wilkins, a Wolters Kluwer business. Philadelphia, PA.
  17. Kisner, C., Colby, L.A. (2012). Therapeutic Exercise: Foundation and techniques 6th edition, F.A. Davis Company. USA
  18. Danneels, L., Dickx, N and Cagnie, B.(2010) Low Back and Pelvic Pain, 7th Interdisciplinary world congress, Proceedings. p.186-195.
  19. Hussein A.M.M., Singh D., Mansor, M., Kamil, O.I.M., Choy, C.Y. Vijayan, R.(2009). Malaysian Low Back Pain guideline. First Edition. Malaysian Association for the Study of pain and Spine society Malaysia
  20. Casser HR, Seddigh S, Rauschmann M. (2016). Acute lumbar back pain-investigation, differential diagnosis and treatment. Deutsches Ärzteblatt International, 113: 223-34.
  21. Waongenngarm, P., Rajaratnam, B. S., & Janwantanakul, P. (2016). Internal Oblique and Transversus Abdominis Muscle Fatigue Induced by Slumped Sitting Posture after 1 Hour of Sitting in Office Workers. Safety and Health at Work 7(1): 49-54.
  22. Dankaerts W., O’Sullivan P., Burnett, A., Straker, L. (2006). Differences in sitting posture are associated with nonspecific chronic low back pain disorders when patients are subclassified. SPINE 31 (6), pp 698-704.
  23. Suzuki H, Kanchiku T, Imajo Y, Yoshida Y, Nishida N, Taguchi T. (2016). Diagnosis and Characters of Non-Specific Low Back Pain in Japan: The Yamaguchi Low Back Pain Study. PLoS ONE 11 (8): e0160454.
  24. Longo G, Loppini M, Denaro L, Maffulli N, Denaro V. (2010). Rating scales for low back pain. British Medical Bulletin, 98 ; 81-144.
  25. Hosseinifar M., Akbari M., Behtash H., Amiri M., Sarrafzadeh, J. (2013). A Comparison between the Effects of Stabilization and Mckenzie’s Exercises on the Pain, Disability, and Lumbo-Pelvic Stability in Patients with Non-Specific Chronic Low Back Pain” Life Sciences Journal ,10(10s); 298-302.
  26. Hawker G.A., Mian, S., Kendzerka, T., French, M. (2011). Measures of Adult Pain. American College of Rheumatology. Arthritis Care & Research 63 (11): pp S240–S252,.
  27. Huskisson EC. (1974). Measurement of pain. Lancet, 2(7889):1127-31.
  28. Lee A, S., Cholewicki, J., Reeves N, P, Zazulak B,T., Mysliwiec, L, W. (2010). Comparison of Trunk Proprioception Between Patients With Low Back Pain and Healthy Controls. Archives of Physical Medicine and Rehabilitation 91 (9):1327-1331.
  29. Wong, T, K, T and Lee, R, Y, W. (2004). Effect of low back pain on the relationship between the movements of lumbar spine and hip. Human Movement Science 23 : 21-34. doi:10.1016/j.humov.2004.03.004.
  30. Franklin, C.V.J., Kalirathinam, D., Palekar T., Nathani N. (2013). Effectiveness of PNF Training for Cronic Low Back Pain. IOSR Journal of Nursing and Health Science (IOSR-JNHS) 2 :41-52.
  31. Reese, N., Bandy, W. (2002). Joint Range of Motion and Muscle Length Testing. Saunders Company. Philadelphia, USA.
  32. Sihawong R., Sitthipornvorakul, E., Paksaichol, A., Janwantanakul P. (2016). Predictors for chronic neck and low back pain in office workers: a 1-year prospective cohort study. Journal of Occupational Health 58: 6-24.
  33. Chhaya, V., Renuka D., Vijaya K., Amol B. (2015). Lumbar range of motion : Reliability between schober’s test and modified schober’s test. Romanian Journal of Physical Therapy 21/ Issue 35/ may/ pp
  34. Kumar A., Zutshi K,. Narang N.(2011). Efficiacy of Trunk Propioceptive Neuromuscular Facilitation Training on Chronic Low Back Pain. International Journal of Sports Science and Engineering 5 (3): pp. 174-180.
  35. Key, J., Chaitow L. (2010). Back Pain: A Movement Problem, A Clinical Approach incorporating relevant research and practice. 1st Edition, Churchill Livingstone, Elsevier. UK.
  36. Melton, B, L., Moqbel, M., Kanaan, S., Sharma, N, K. (2016). Structural Equation Model of Disability in Low Back Pain, Spine, 41(20), 1621.
  37. Davis, D, S., Mancinelli, C, A, Petronis, J, J., Bensenhaver, C., Mcclintic, T., Nelson, G. (2013). Variables associated with level of disability in working individuals with nonacute low back pain: a cross-sectional investigation. Journal of orthopaedic & sports physical therapy 43 (2), 97-104.
  38. Di Iorio, A,.Abate, M,. Guralnik, J,M., Bandinelli,S,. Cecchi, F,.Cherubini,A., Corsonello, A.,  Foschini, N., Guglielmi, M., Lauretani, F., Volpato, S., Abate, G., Ferrucci, L. (2007). From Chronic Low Back Pain to Disability, a Multifactorial. Spine (Phila Pa 1976). 32(26): E809–E815.
  39. Seif, H.E., et al. (2015) The Effect of Stretching Hamstring, Gastrocnemius, Iliopsoas and Back Muscles on Pain and Functional Activities in Patients with Chronic Low Back Pain: A Randomized Clinical Trial. Open Journal of Therapy and Rehabilitation 3: 139-145.
  40. Vincent, J.I., MacDermit, J.C., Grewal, R., Sekar, V.P., Balachadran, D. (2014). Translation of Oswestry Disability Index into Tamil with cross cultural adaptation and evaluation of reliability and validity. The Open Orthopedic Journal 8: 11-19.
  41. Anggiat, L., Hon, W. H. C., Sokran, S. N. B. B. M., & Mohammad, N. M. B. (2020). The changes of functional disability in non-specific low back pain among university population after proprioceptive neuromuscular facilitation and mckenzie method. International Journal of Medical and Exercise Science, 6(1), 656-667.
  42. Fairbank J, and Pynsent P. (2000). The Oswestry Disability Index. SPINE, Lippincott Williams & Wilkins, Inc 25(2) : 2940-2953.
  43. Delitto, A., George, S., van Dillen, L., Whitman J., Sowa G., Shekelle P. Godges, J, J. (2012). Low back pain : clinical practice guidelines linked     to the international classification of functioning disability, and health from the orthopaedic section of the American Physical Therapy Association. Journal of orthopaedic and sport physical therapy. 42 (4).pp
  44.  Yi, H., Ji, X., Wei, X., Chen, Z., Wang, X., Zhu, X. & Li, M. (2012). Reliability and validity of simplified Chinese version of Roland-Morris questionnaire in evaluating rural and urban patients with low back pain. PLoS one, 7(1), e30807.
  45. Stevens, M. L., Lin, C. C., & Maher, C. G. (2016). The roland morris disability questionnaire. Journal of physio-therapy,  62(2), 116.
  46. Montgomery, W., Vietri, J.,  Shi, J., Ogawa, K., Kariyasu, S., Alev, L., Nakamura., M, (2016), The relationship between pain severity and patient-reported outcomes among patient with chronic low back pain in Japan, Journal of Pain Research 9:337-344.
  47. Tsuji T., Mastudaira K., Sato H., Vietri J. (2016). The impact of depression among chronic low back pain patients in Japan. BMC Musculoskeletal Disorders. Biomed Central. 17:447.
  48. Kennedy C, Kassab O, Gilkey D., Linnel, S., Morris D.(2008) Psychosocial Factors and Low Back Pain Among College Students. Journal of American College Health, 57:2, 191-196.
  49. Younsi, M., (2015), Health-related quality of life measures: Evidence from Tunisian population using the SF-12 Health Survey. International Society of Pharmaco-economics and Outcome Research (ISPOR). Elsevier, 7C: 55-66.
  50. Resnik, L., and Dobrzykowski,E. (2003).Guide to outcome measurement for Patient with Low Back Pain syndromes, Journal of Orthopedic and Sport Physical Therapy 33: 307-318.
  51. Gordon, R., Bloxham,  S. (2016). A Sytematic review of the effects of exercise and physical activity on non-specific cronic low back pain, Healthcare journal 4(22): 10.3390.
  52. Scharrer M, Ebenbichler G, Peiber K, Crevenna, Gruther W, Zorn C, Grimm- Steiger, Herceg M, Keilani M, Ammer K.(2012). As ystematic review on the effectiveness of medical training therapy for subacute and chronic low back pain. European Journal Physical Rehabilitation Medicine 48: 361-70.
  53. Sihawong, R., Janwantanakul, P., & Jiamjarasrangsi, W. (2014). A prospective, cluster-randomized controlled trial of exercise program to prevent low back pain in office workers. European Spine Journal 23(4): 786–793.
  54. Goertz M, Thorson D, Bonsell J, Bonte B, Campbell R, Haake B, Johnson K, Kramer C, Mueller B, Peterson S, Setterlund L, Timming R. (2012). Adult Acute and Subacute Low Back Pain. Institute for Clinical Systems Improvement.
  55. Arya, R.K. (2014). Low Back Pain-Sign, symptoms, and management, Journal, Indian Academy of Clinical Medicine 15 (1), 30-41.
  56. Oliveira, C. B., Maher, C. G., Pinto, R. Z., Traeger, A. C., Lin, C. W. C., Chenot, J. F.,& Koes, B. W. (2018). Clinical practice guidelines for the management of non-specific low back pain in primary care: an updated overview. European Spine Journal, 27(11), 2791-2803.
  57. Areeudomwong, P., & Buttagat, V. (2019). Comparison of Core Stabilisation Exercise and Proprioceptive Neuromuscular Facilitation Training on Pain-related and Neuromuscular Response Outcomes for Chronic Low Back Pain: A Randomised Controlled Trial. The Malaysian Journal of Medical Sciences: MJMS, 26(6), 77.
  58. Niederer, D., & Mueller, J. (2020). Sustainability effects of motor control stabilisation exercises on pain and function in chronic nonspecific low back pain patients: A systematic review with meta-analysis and meta-regression. PloS one, 15(1), e0227423.
  59. Sanchis-Sánchez, E., Lluch-Girbés, E., Guillart-Castells, P., Georgieva, S., García-Molina, P., & Blasco, J. M. (2020). Effectiveness of mechanical diagnosis and therapy in patients with non-specific chronic low back pain: a literature review with meta-analysis. Brazilian Journal of Physical Therapy.
  60. Areeudomwong, P., & Buttagat, V. (2019). Proprioceptive neuromuscular facilitation training improves pain-related and balance outcomes in working-age patients with chronic low back pain: a randomized controlled trial. Brazilian Journal of Physical Therapy, 23(5), 428-436.
Citation:   Lucky  Anggiat (2020).  A brief review in Non-Specific Low Back Pain: Evaluation and physiotherapy intervention, ijmaes;  6 (3); 760-769.